
Turn on suggestions
Auto-suggest helps you quickly narrow down your search results by suggesting possible matches as you type.
Splunk Search
×
Join the Conversation
Without signing in, you're just watching from the sidelines. Sign in or Register to connect, share, and be part of the Splunk Community.
- Find Answers
- :
- Using Splunk
- :
- Splunk Search
- :
- timechart response time from proxy servers
Options
- Subscribe to RSS Feed
- Mark Topic as New
- Mark Topic as Read
- Float this Topic for Current User
- Bookmark Topic
- Subscribe to Topic
- Mute Topic
- Printer Friendly Page
- Mark as New
- Bookmark Message
- Subscribe to Message
- Mute Message
- Subscribe to RSS Feed
- Permalink
- Report Inappropriate Content
timechart response time from proxy servers

rstrong30
Loves-to-Learn
08-24-2023
01:51 PM
I simply need to timechart the numeric values from field that is being returned. For example
index=proxy | timechart count by resp_time. getting something like this:
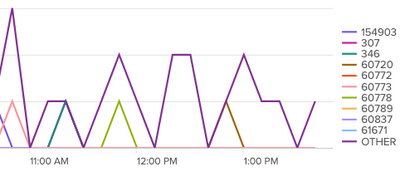
I need one line that charts all the values... instead it splits them up by how many times it has seen each value.
- Mark as New
- Bookmark Message
- Subscribe to Message
- Mute Message
- Subscribe to RSS Feed
- Permalink
- Report Inappropriate Content

bowesmana

SplunkTrust
08-24-2023
06:43 PM
If there are multiple values for the same time, what do you want to show on that single line?
You are splitting by value, so instead just do
index=proxy
| timechart max(resp_time)
or you could use avg() or some other aggregation.


Got questions? Get answers!
Join the Splunk Community Slack to learn, troubleshoot, and make connections with fellow Splunk practitioners in real time!
Meet up IRL or virtually!
Join Splunk User Groups to connect and learn in-person by region or remotely by topic or industry.
Get Updates on the Splunk Community!
From Raw Data to Executive-Ready Stories, Faster
Build Data Stories for Every Audience
A dashboard is rarely just a dashboard. It might be the view an ...
Guided Onboarding with Auto-schema Is Now Generally Available
We are excited to announce the General Availability of Guided Onboarding with Auto-Schematization ...
ATTENTION: We’re Moving! (AGAIN!)
The Splunk Community Slack is undergoing a system migration to keep our workspace secure and ...
