Turn on suggestions
Auto-suggest helps you quickly narrow down your search results by suggesting possible matches as you type.
Splunk Search
×
Join the Conversation
Without signing in, you're just watching from the sidelines. Sign in or Register to connect, share, and be part of the Splunk Community.
Turn on suggestions
Auto-suggest helps you quickly narrow down your search results by suggesting possible matches as you type.
- Find Answers
- :
- Using Splunk
- :
- Splunk Search
- :
- timechart response time from proxy servers
Options
- Subscribe to RSS Feed
- Mark Topic as New
- Mark Topic as Read
- Float this Topic for Current User
- Bookmark Topic
- Subscribe to Topic
- Mute Topic
- Printer Friendly Page
- Mark as New
- Bookmark Message
- Subscribe to Message
- Mute Message
- Subscribe to RSS Feed
- Permalink
- Report Inappropriate Content
timechart response time from proxy servers
rstrong30
Loves-to-Learn
08-24-2023
01:51 PM
I simply need to timechart the numeric values from field that is being returned. For example
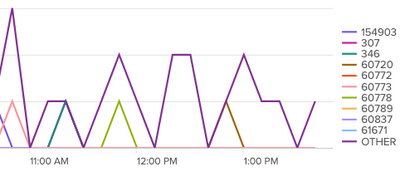
index=proxy | timechart count by resp_time. getting something like this:
I need one line that charts all the values... instead it splits them up by how many times it has seen each value.
- Mark as New
- Bookmark Message
- Subscribe to Message
- Mute Message
- Subscribe to RSS Feed
- Permalink
- Report Inappropriate Content
bowesmana

SplunkTrust
08-24-2023
06:43 PM
If there are multiple values for the same time, what do you want to show on that single line?
You are splitting by value, so instead just do
index=proxy
| timechart max(resp_time)
or you could use avg() or some other aggregation.
Get Updates on the Splunk Community!
Unlock Database Monitoring with Splunk Observability Cloud
In today’s fast-paced digital landscape, even minor database slowdowns can disrupt user experiences and ...
Purpose in Action: How Splunk Is Helping Power an Inclusive Future for All
At Cisco, purpose isn’t a tagline—it’s a commitment. Cisco’s FY25 Purpose Report outlines how the company is ...
[Upcoming Webinar] Demo Day: Transforming IT Operations with Splunk
Join us for a live Demo Day at the Cisco Store on January 21st 10:00am - 11:00am PST
In the fast-paced world ...

