
Turn on suggestions
Auto-suggest helps you quickly narrow down your search results by suggesting possible matches as you type.
Splunk Search
×
Join the Conversation
Without signing in, you're just watching from the sidelines. Sign in or Register to connect, share, and be part of the Splunk Community.
- Find Answers
- :
- Using Splunk
- :
- Splunk Search
- :
- Re: How to create average duration over time overl...
Options
- Subscribe to RSS Feed
- Mark Topic as New
- Mark Topic as Read
- Float this Topic for Current User
- Bookmark Topic
- Subscribe to Topic
- Mute Topic
- Printer Friendly Page
- Mark as New
- Bookmark Message
- Subscribe to Message
- Mute Message
- Subscribe to RSS Feed
- Permalink
- Report Inappropriate Content

kmedara
Engager
09-25-2019
12:08 PM
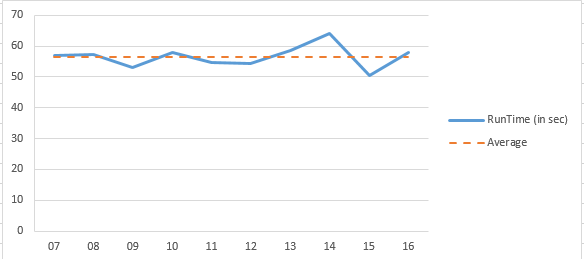
I have a time chart that displays the average duration of calls for each day in the time range, the time range is set with a time picker. The call duration is parsed out using the rex command.
rex field=_raw "Duration : (?<hh>\d+):(?<mm>\d+):(?<ss>\d+\.\d+)" | eval dur = (hh * 3600) + (mm * 60) + ss | timechart span=1d avg(dur)
The current results look like:

I am looking for something like this with the dashed line like so:
1 Solution
- Mark as New
- Bookmark Message
- Subscribe to Message
- Mute Message
- Subscribe to RSS Feed
- Permalink
- Report Inappropriate Content

adonio
Ultra Champion
09-25-2019
01:34 PM
please elaborate, what will be the data populating the chart overlay?
try this search anywhere, in the case you are perusing some sort of running average:
| gentimes start=-7 increment=2h
| eval _time = starttime
| eval duration = random()%1000 + 3000
| sort - _time
| timechart span=4h avg(duration) as avg_dur
| streamstats time_window=24h avg(avg_dur) as dur_running_avg
- Mark as New
- Bookmark Message
- Subscribe to Message
- Mute Message
- Subscribe to RSS Feed
- Permalink
- Report Inappropriate Content
adonio
Ultra Champion
09-25-2019
01:34 PM
please elaborate, what will be the data populating the chart overlay?
try this search anywhere, in the case you are perusing some sort of running average:
| gentimes start=-7 increment=2h
| eval _time = starttime
| eval duration = random()%1000 + 3000
| sort - _time
| timechart span=4h avg(duration) as avg_dur
| streamstats time_window=24h avg(avg_dur) as dur_running_avg
- Mark as New
- Bookmark Message
- Subscribe to Message
- Mute Message
- Subscribe to RSS Feed
- Permalink
- Report Inappropriate Content
kmedara
Engager
09-25-2019
01:58 PM
streamstats avg(avg_dur) was exactly what I needed, thank you
- Mark as New
- Bookmark Message
- Subscribe to Message
- Mute Message
- Subscribe to RSS Feed
- Permalink
- Report Inappropriate Content
adonio
Ultra Champion
09-25-2019
02:21 PM
cool,
converting to an answer, kindly accept it so other will know it worked for you




Got questions? Get answers!
Join the Splunk Community Slack to learn, troubleshoot, and make connections with fellow Splunk practitioners in real time!
Meet up IRL or virtually!
Join Splunk User Groups to connect and learn in-person by region or remotely by topic or industry.
Get Updates on the Splunk Community!
SOC4Kafka - New Kafka Connector Powered by OpenTelemetry
The new SOC4Kafka connector, built on OpenTelemetry, enables the collection of Kafka messages and forwards ...
Rounding off the Splunk Dashboard Contest
What does a contest-winning Splunk dashboard look like? In this case, it isn't in a browser tab at all. It ...
A Four Part Event Series: AI + Observability: AI Agents, LLMs, Apps, & Infrastructure
AI + Observability: AI Agents, LLMs, Apps, & Infrastructure
The rapid evolution of artificial intelligence ...
