
Join the Conversation
- Find Answers
- :
- Using Splunk
- :
- Dashboards & Visualizations
- :
- Re: Multi-variable Bar Graph
- Subscribe to RSS Feed
- Mark Topic as New
- Mark Topic as Read
- Float this Topic for Current User
- Bookmark Topic
- Subscribe to Topic
- Mute Topic
- Printer Friendly Page
- Mark as New
- Bookmark Message
- Subscribe to Message
- Mute Message
- Subscribe to RSS Feed
- Permalink
- Report Inappropriate Content

Hi I am trying to make a multi-variable bar graph (Similar to the image below)
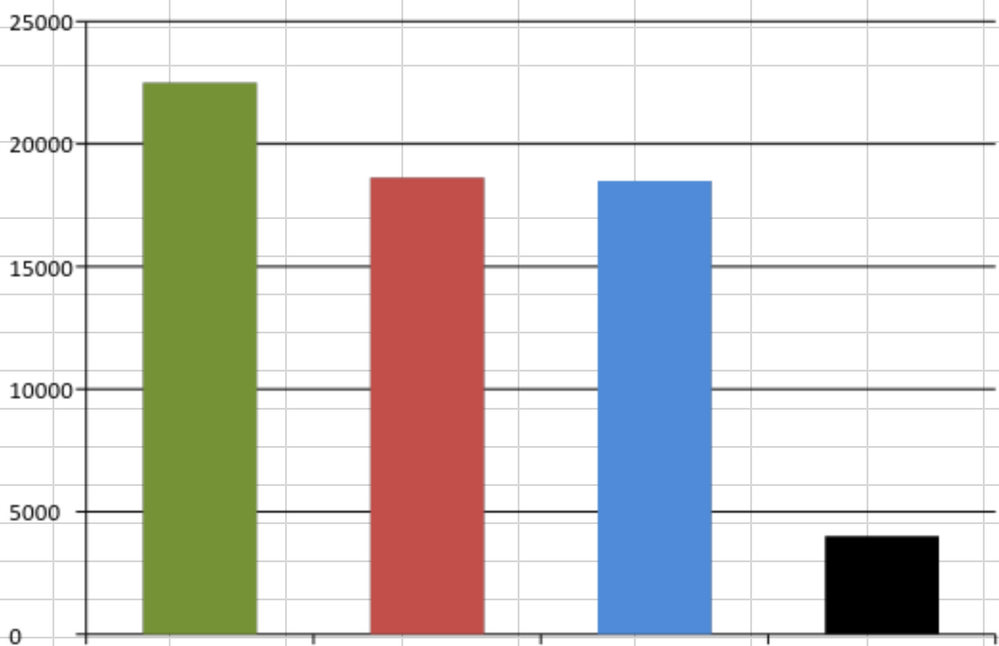
The first bar would be a static number: 22500
The second bar would be this search:
| inputlookup Report.csv | search u_last_policyrequest_time=*| fields u_last_policyrequest_time| eval Last_Policy_Request = strptime(u_last_policyrequest_time, "%m/%d/%Y %H:%M") | where Last_Policy_Request > relative_time(now(),"-48h")
The third bar would be this search: |inputlookup Report.csv|rename u_wifi_mac_address as Mac_Address | stats count as ActiveDevices by Mac_Address|stats sum(ActiveDevices) as SNTotal_Asset_Records|table SNTotal_Asset_Records
The fourth bar would be this search: |inputlookup Report.csv|rename u_wifi_mac_address as Mac_Address | stats count as ActiveDevices by Mac_Address|stats sum(ActiveDevices) as ActiveDevices | eval No_Record = 22500-ActiveDevices |table No_Record
I am not sure if it is possible to combine them like this. All of these results come from the same place.
- Mark as New
- Bookmark Message
- Subscribe to Message
- Mute Message
- Subscribe to RSS Feed
- Permalink
- Report Inappropriate Content

Another version
| inputlookup Report.csv
| stats count(eval(strptime(u_last_policyrequest_time,"%m/%d/%Y %H:%M")>relative_time(now(),"-48h")))) as Policy_Request_last2days
count(Mac_Address) as SNTotal_Asset_Records
| eval No_Record=22500-SNTotal_Asset_Records
| eval BaseBar=22500
| table BaseBar Policy_Request_last2days SNTotal_Asset_Records No_Record
- Mark as New
- Bookmark Message
- Subscribe to Message
- Mute Message
- Subscribe to RSS Feed
- Permalink
- Report Inappropriate Content
Another version
| inputlookup Report.csv
| stats count(eval(strptime(u_last_policyrequest_time,"%m/%d/%Y %H:%M")>relative_time(now(),"-48h")))) as Policy_Request_last2days
count(Mac_Address) as SNTotal_Asset_Records
| eval No_Record=22500-SNTotal_Asset_Records
| eval BaseBar=22500
| table BaseBar Policy_Request_last2days SNTotal_Asset_Records No_Record
- Mark as New
- Bookmark Message
- Subscribe to Message
- Mute Message
- Subscribe to RSS Feed
- Permalink
- Report Inappropriate Content

Heh. I need to practice typing | stats count(eval(blahblahblah)) until I have convinced myself that the code will actually run...
- Mark as New
- Bookmark Message
- Subscribe to Message
- Mute Message
- Subscribe to RSS Feed
- Permalink
- Report Inappropriate Content
Lots of ways to do this, here's one...
| inputlookup Report.csv
| search u_last_policyrequest_time=*  OR isnotnull(u_wifi_mac_address)
| eval Last_Policy_Request = strptime(u_last_policyrequest_time, "%m/%d/%Y %H:%M")
| eval policyCount=if(Last_Policy_Request > relative_time(now(),"-48h"),1,0)
| eval macCount=if(isnotnull(u_wifi_mac_address),1,0)
| stats sum(policyCount) as bar2, sum(macCount) as bar3
| eval bar1=22500
| eval bar4=bar1-bar3



Join the Splunk Community Slack to learn, troubleshoot, and make connections with fellow Splunk practitioners in real time!
Join Splunk User Groups to connect and learn in-person by region or remotely by topic or industry.
Best Practices: Splunk auto adjust pipeline queue
Laser Bananas and Edge Hubs: Exploring Operational Technology (OT) Data Through a ...
Event Series: Mastering AI Tokenomics and Splunk Agent Observability
