
Join the Conversation
- Find Answers
- :
- Using Splunk
- :
- Dashboards & Visualizations
- :
- Re: Chart filtering on TOP 5
- Subscribe to RSS Feed
- Mark Topic as New
- Mark Topic as Read
- Float this Topic for Current User
- Bookmark Topic
- Subscribe to Topic
- Mute Topic
- Printer Friendly Page
- Mark as New
- Bookmark Message
- Subscribe to Message
- Mute Message
- Subscribe to RSS Feed
- Permalink
- Report Inappropriate Content
How to make Chart filtering on TOP 5?

Hi all
I'm struggling to make my chart how I want it.
Basically what I currently have, is a graph with a lot of logs received from certain services.
And that from the past 3 months.
- I don't understand why my months are ordered like this: 2022 December, 2023 February, 2023 January
Where January should be in the middle.
- Aside from this, my main struggle is to filter the top services with the highes
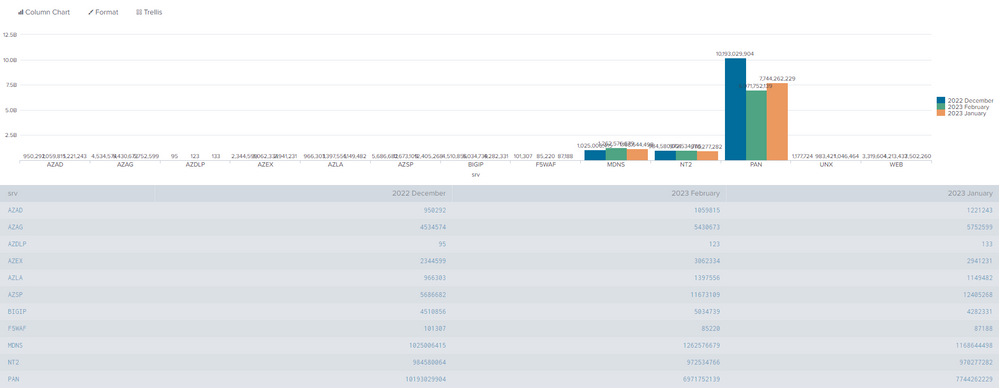
t logs. These are a lot higher than the other ones. So I'll have to make a 2nd graph with the smaller ones.
How can I filter the the top (say 4) out? (AND srv!=*** is not the proper way to do it in this case)
|dbxquery query="select to_char(received_ts,'YYYY Month') as Month,srv,sum(log_Count) as Total_Log_Count
from gmssp.esm.esm_audit_day
where client_id = ****
AND received_ts>= DATE_TRUNC('month', current_date) - '3 month'::interval
AND received_ts< DATE_TRUNC('month', current_date)
AND SRV!='ignor'
AND SRV!='UNK'
group by srv, month" connection="******"
| chart max(total_log_count) by srv month
Thanks a lot for your help!
- Mark as New
- Bookmark Message
- Subscribe to Message
- Mute Message
- Subscribe to RSS Feed
- Permalink
- Report Inappropriate Content


The chart is ordered the way it is because X-axis labels are sorted lexicographically. "2022" comes before "2023" and "F" comes before "J". To put them into date order, you'd have to convert the month field into epoch form using strptime then use fieldformat to specify how it should be displayed.
The chart command has a limit option you can use to control how many results are displayed.
|dbxquery query="select to_char(received_ts,'YYYY Month') as Month,srv,sum(log_Count) as Total_Log_Count
from gmssp.esm.esm_audit_day
where client_id = ****
AND received_ts>= DATE_TRUNC('month', current_date) - '3 month'::interval
AND received_ts< DATE_TRUNC('month', current_date)
AND SRV!='ignor'
AND SRV!='UNK'
group by srv, month" connection="******"
| eval month = strptime(month, "%Y %B")
| chart limit=top 4 max(total_log_count) by srv month
| fieldformat month = strftime(month, "%Y %B")
If this reply helps you, Karma would be appreciated.
- Mark as New
- Bookmark Message
- Subscribe to Message
- Mute Message
- Subscribe to RSS Feed
- Permalink
- Report Inappropriate Content

hi @Splunker7 ,
at first Splunk isn't a database client, even if you can extract data from a database but in this way you have very low performaces: the best approach is to schedule a data extraction saving data in Splunk and then run searches on the index where you stored extracted data.
Then, charts are ordered in alphabetical order, for this reson january comes after february.
Convert tour dates in numbers (2023-02 instead of 2023-February) and you'll have an ordered chart.
About the second question,you could use a logarythmic scale to disaply your data to avoid great differences in column high.
Then if you want to exclude some results, you can use the where condition to filter your data
...
| stats max(total_log_count) AS max BY srv month
| where max<1000
I used 1000 as threshold but you can use the value you like.
Ciao.
Giuseppe
- Mark as New
- Bookmark Message
- Subscribe to Message
- Mute Message
- Subscribe to RSS Feed
- Permalink
- Report Inappropriate Content
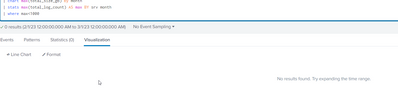
Hi @gcusello
I've tried this already, but then I receive:
"No results found. Try expanding the time range."
- Mark as New
- Bookmark Message
- Subscribe to Message
- Mute Message
- Subscribe to RSS Feed
- Permalink
- Report Inappropriate Content
- Mark as New
- Bookmark Message
- Subscribe to Message
- Mute Message
- Subscribe to RSS Feed
- Permalink
- Report Inappropriate Content
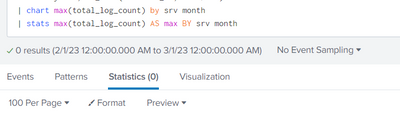
No results found
- Mark as New
- Bookmark Message
- Subscribe to Message
- Mute Message
- Subscribe to RSS Feed
- Permalink
- Report Inappropriate Content
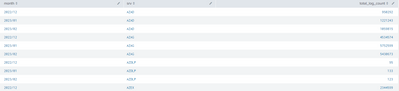
Hi @Splunker7 ,
please run your main search (without stats) and check the presence of the following fields:
- total_log_count
- srv
- month
and if srv and month have the 100% of values.
Ciao.
Giuseppe
- Mark as New
- Bookmark Message
- Subscribe to Message
- Mute Message
- Subscribe to RSS Feed
- Permalink
- Report Inappropriate Content


Join the Splunk Community Slack to learn, troubleshoot, and make connections with fellow Splunk practitioners in real time!
Join Splunk User Groups to connect and learn in-person by region or remotely by topic or industry.
SOC4Kafka - New Kafka Connector Powered by OpenTelemetry
Event Series: Level up your SOC: Advancing with Splunk Enterprise Security
Announcing Modern Navigation: A New Era of Splunk User Experience
