
Join the Conversation
- Find Answers
- :
- Using Splunk
- :
- Splunk Search
- :
- Why is there no link between the two data points i...
- Subscribe to RSS Feed
- Mark Topic as New
- Mark Topic as Read
- Float this Topic for Current User
- Bookmark Topic
- Subscribe to Topic
- Mute Topic
- Printer Friendly Page
- Mark as New
- Bookmark Message
- Subscribe to Message
- Mute Message
- Subscribe to RSS Feed
- Permalink
- Report Inappropriate Content

So i have a trendline like below:
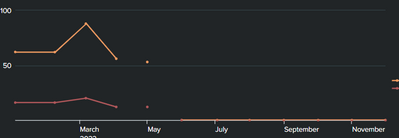
I dont know why is there no link between the two data points between april and may and may and june.
Here is the query i have:
| inputlookup category
| eval _time=strptime(_time, "%m/%d/%Y")
| search envcor="$env$"
| eval group=envcor."_"
| timechart sum(Total_Number_Unique_Names) sum(Total_Number_Shops) by group
Please help. Thanks.
- Mark as New
- Bookmark Message
- Subscribe to Message
- Mute Message
- Subscribe to RSS Feed
- Permalink
- Report Inappropriate Content

Have you looked at the underlying data to validate there's (consistent) data for April? If you want to connect the lines you can try setting null values to "Connect" in the visualization settings:
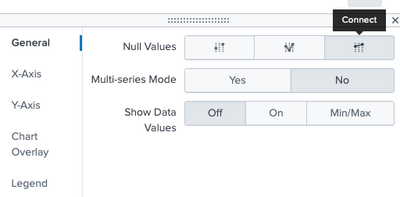
Or you could use the filldown command, which replaces null values with the last non-null value.
| filldown <fields>
https://docs.splunk.com/Documentation/Splunk/latest/SearchReference/Filldown
- Mark as New
- Bookmark Message
- Subscribe to Message
- Mute Message
- Subscribe to RSS Feed
- Permalink
- Report Inappropriate Content
Have you looked at the underlying data to validate there's (consistent) data for April? If you want to connect the lines you can try setting null values to "Connect" in the visualization settings:
Or you could use the filldown command, which replaces null values with the last non-null value.
| filldown <fields>
https://docs.splunk.com/Documentation/Splunk/latest/SearchReference/Filldown
- Mark as New
- Bookmark Message
- Subscribe to Message
- Mute Message
- Subscribe to RSS Feed
- Permalink
- Report Inappropriate Content
Perfect, This solution worked perfectly. Thanks alot. @rut


Join the Splunk Community Slack to learn, troubleshoot, and make connections with fellow Splunk practitioners in real time!
Join Splunk User Groups to connect and learn in-person by region or remotely by topic or industry.
A Four-Part Event Series: Full Stack Observability For the AI Era
SOC4Kafka - New Kafka Connector Powered by OpenTelemetry
Event Series: Level up your SOC: Advancing with Splunk Enterprise Security
