
Turn on suggestions
Auto-suggest helps you quickly narrow down your search results by suggesting possible matches as you type.
Splunk Search
×
Join the Conversation
Without signing in, you're just watching from the sidelines. Sign in or Register to connect, share, and be part of the Splunk Community.
- Find Answers
- :
- Using Splunk
- :
- Splunk Search
- :
- Trouble creating column chart based off 1 event
Options
- Subscribe to RSS Feed
- Mark Topic as New
- Mark Topic as Read
- Float this Topic for Current User
- Bookmark Topic
- Subscribe to Topic
- Mute Topic
- Printer Friendly Page
- Mark as New
- Bookmark Message
- Subscribe to Message
- Mute Message
- Subscribe to RSS Feed
- Permalink
- Report Inappropriate Content

sam_
Engager
06-25-2021
01:14 AM
Hi,
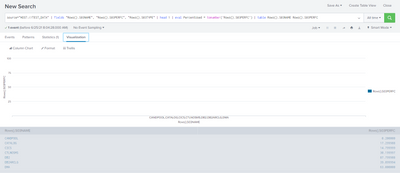
I am attempting to create a simple column chart using JSON data from a single event.
The Rows{}.S03PERFC value represents a percent number... I have attempted to convert this but still can't seem to get it to display as a chart.
For some reason the fields are greyed out at the bottom.
Anything obvious I'm missing here?
1 Solution
- Mark as New
- Bookmark Message
- Subscribe to Message
- Mute Message
- Subscribe to RSS Feed
- Permalink
- Report Inappropriate Content

ITWhisperer

SplunkTrust
06-25-2021
01:39 AM
The clue is in the title - you only have one event. You should try expanding the Rows{} collection before extracting the fields within it
| spath output=Rows path=Rows{}
| mvexpand Rows
| spath input=Rows- Mark as New
- Bookmark Message
- Subscribe to Message
- Mute Message
- Subscribe to RSS Feed
- Permalink
- Report Inappropriate Content
ITWhisperer
SplunkTrust
06-25-2021
01:39 AM
The clue is in the title - you only have one event. You should try expanding the Rows{} collection before extracting the fields within it
| spath output=Rows path=Rows{}
| mvexpand Rows
| spath input=Rows- Mark as New
- Bookmark Message
- Subscribe to Message
- Mute Message
- Subscribe to RSS Feed
- Permalink
- Report Inappropriate Content
sam_
Engager
08-17-2021
07:24 PM
Thanks @ITWhisperer - that did the trick perfectly!


Got questions? Get answers!
Join the Splunk Community Slack to learn, troubleshoot, and make connections with fellow Splunk practitioners in real time!
Meet up IRL or virtually!
Join Splunk User Groups to connect and learn in-person by region or remotely by topic or industry.
Get Updates on the Splunk Community!
A Four-Part Event Series: Full Stack Observability For the AI Era
As AI reshapes applications, infrastructure, and the way teams operate, the traditional boundaries of ...
SOC4Kafka - New Kafka Connector Powered by OpenTelemetry
The new SOC4Kafka connector, built on OpenTelemetry, enables the collection of Kafka messages and forwards ...
Event Series: Level up your SOC: Advancing with Splunk Enterprise Security
AI has fundamentally raised the stakes for security operations, and this three-part series is your guide to ...
