
Turn on suggestions
Auto-suggest helps you quickly narrow down your search results by suggesting possible matches as you type.
Splunk Search
×
Join the Conversation
Without signing in, you're just watching from the sidelines. Sign in or Register to connect, share, and be part of the Splunk Community.
- Find Answers
- :
- Using Splunk
- :
- Splunk Search
- :
- Re: STACKED area chart??
Options
- Subscribe to RSS Feed
- Mark Topic as New
- Mark Topic as Read
- Float this Topic for Current User
- Bookmark Topic
- Subscribe to Topic
- Mute Topic
- Printer Friendly Page
- Mark as New
- Bookmark Message
- Subscribe to Message
- Mute Message
- Subscribe to RSS Feed
- Permalink
- Report Inappropriate Content

a277437
Explorer
08-03-2021
06:28 PM
Will Splunk do a stacked area chart? I'm able to get an area chart, but it's not 'stacked' (so each proxy totals to an aggregate). I'm wondering if splunk can even do that? I looked at the documentation and it appeared that it could, so I'm hoping maybe I'm just doing something wrong. Under the 'Visualization"
index = "myindex"| bin _time span=5m
| stats sum(cs_bytes) as Bytes by proxy_server _time
| eval Kbps=(((Bytes*8)/1000)/300)
| timechart span=5m list(Kbps) by proxy_server
1 Solution
- Mark as New
- Bookmark Message
- Subscribe to Message
- Mute Message
- Subscribe to RSS Feed
- Permalink
- Report Inappropriate Content

ITWhisperer

SplunkTrust
08-03-2021
10:34 PM
- Mark as New
- Bookmark Message
- Subscribe to Message
- Mute Message
- Subscribe to RSS Feed
- Permalink
- Report Inappropriate Content
a277437
Explorer
08-03-2021
06:30 PM
Continuing from above... "Under the Visualization" I selected the area chart.
Thank you!
- Mark as New
- Bookmark Message
- Subscribe to Message
- Mute Message
- Subscribe to RSS Feed
- Permalink
- Report Inappropriate Content
ITWhisperer
SplunkTrust
08-03-2021
10:34 PM
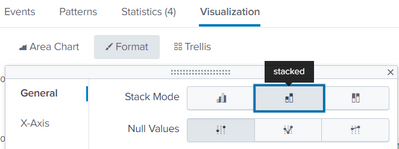
Change the format of the area chart to stacked
- Mark as New
- Bookmark Message
- Subscribe to Message
- Mute Message
- Subscribe to RSS Feed
- Permalink
- Report Inappropriate Content
a277437
Explorer
08-04-2021
08:05 AM
That's it!!! Thank you!


Got questions? Get answers!
Join the Splunk Community Slack to learn, troubleshoot, and make connections with fellow Splunk practitioners in real time!
Meet up IRL or virtually!
Join Splunk User Groups to connect and learn in-person by region or remotely by topic or industry.
Get Updates on the Splunk Community!
Splunk App Dev Quarterly Roundup: AI, Agents, and Innovation!
Another quarter, another wave of innovation. From complex integrations to pushing the limits ...
Federated Search for Dynamic Data Self Storage Is Now Generally Available on Splunk ...
Splunk is excited to announce the General Availability of Federated Search for Dynamic Data Self Storage ...
Index This | What has many keys but can’t unlock a door?
July 2026 Edition
Hayyy Splunk Education Enthusiasts and the Eternally Curious!
We’re back with this ...
