
Join the Conversation
- Find Answers
- :
- Using Splunk
- :
- Splunk Search
- :
- STACKED area chart??
- Subscribe to RSS Feed
- Mark Topic as New
- Mark Topic as Read
- Float this Topic for Current User
- Bookmark Topic
- Subscribe to Topic
- Mute Topic
- Printer Friendly Page
- Mark as New
- Bookmark Message
- Subscribe to Message
- Mute Message
- Subscribe to RSS Feed
- Permalink
- Report Inappropriate Content

Will Splunk do a stacked area chart? I'm able to get an area chart, but it's not 'stacked' (so each proxy totals to an aggregate). I'm wondering if splunk can even do that? I looked at the documentation and it appeared that it could, so I'm hoping maybe I'm just doing something wrong. Under the 'Visualization"
index = "myindex"| bin _time span=5m
| stats sum(cs_bytes) as Bytes by proxy_server _time
| eval Kbps=(((Bytes*8)/1000)/300)
| timechart span=5m list(Kbps) by proxy_server
- Mark as New
- Bookmark Message
- Subscribe to Message
- Mute Message
- Subscribe to RSS Feed
- Permalink
- Report Inappropriate Content


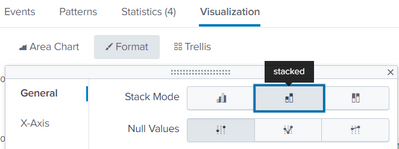
Change the format of the area chart to stacked
- Mark as New
- Bookmark Message
- Subscribe to Message
- Mute Message
- Subscribe to RSS Feed
- Permalink
- Report Inappropriate Content
Continuing from above... "Under the Visualization" I selected the area chart.
Thank you!
- Mark as New
- Bookmark Message
- Subscribe to Message
- Mute Message
- Subscribe to RSS Feed
- Permalink
- Report Inappropriate Content
Change the format of the area chart to stacked
- Mark as New
- Bookmark Message
- Subscribe to Message
- Mute Message
- Subscribe to RSS Feed
- Permalink
- Report Inappropriate Content
That's it!!! Thank you!


Join the Splunk Community Slack to learn, troubleshoot, and make connections with fellow Splunk practitioners in real time!
Join Splunk User Groups to connect and learn in-person by region or remotely by topic or industry.
Your Feedback. Our Roadmap. Visit the PX Feedback Booth at .conf26
Agentic SOC Triage: Investigating Splunk ES Notables with MCP Server and a Local LLM
Painting a Clearer Picture: Creating Cross-Domain Visibility with AI Canvas
