Join the Conversation
- Find Answers
- :
- Using Splunk
- :
- Splunk Search
- :
- Reporting
- Subscribe to RSS Feed
- Mark Topic as New
- Mark Topic as Read
- Float this Topic for Current User
- Bookmark Topic
- Subscribe to Topic
- Mute Topic
- Printer Friendly Page
- Mark as New
- Bookmark Message
- Subscribe to Message
- Mute Message
- Subscribe to RSS Feed
- Permalink
- Report Inappropriate Content
Reporting
Hi Splunkers!
Hope you guys are doing good.
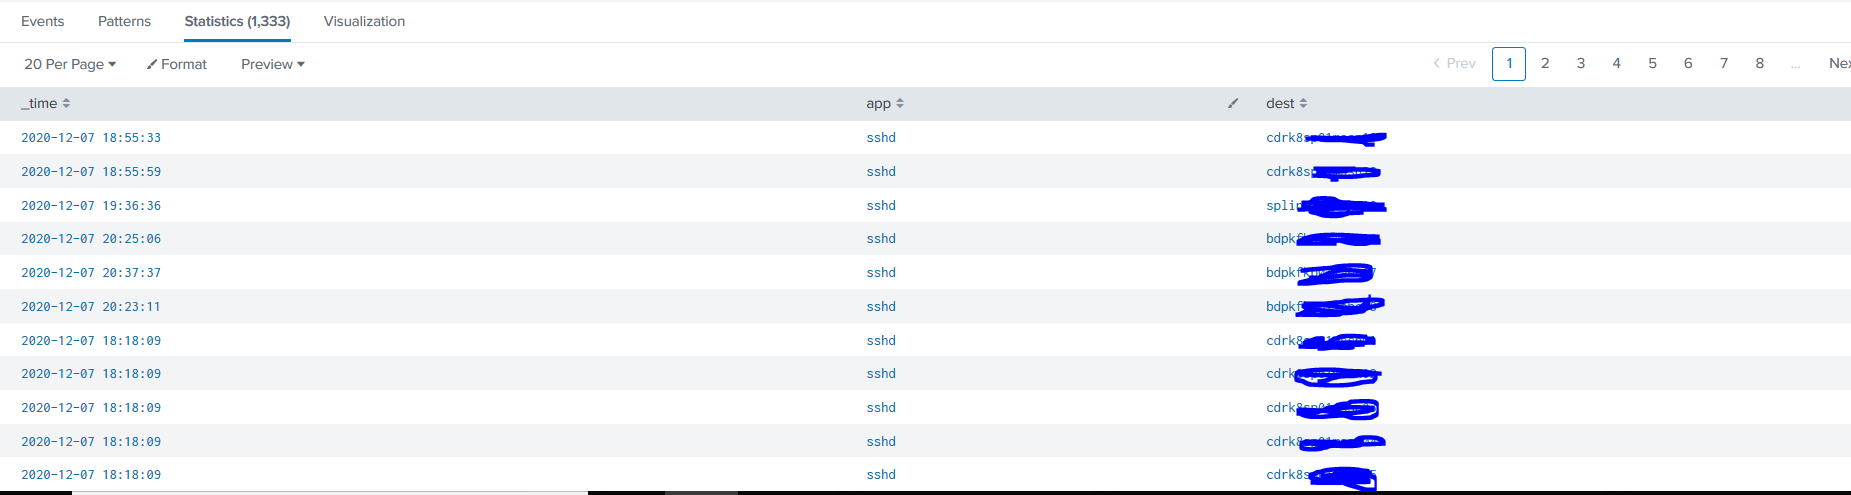
I'm working on a usecase where I have to show daily chart of overall results of search. I'm attaching a screenshot below. I'm trying to show a daily count of the number in a line graph. For Example (see screenshot): I got 1350 dest statistics today and 1200 dest statistics yesteday. I want to show both on the line graph with dates.
by doing timechart count by dest is not giving accurate results.
Thanks in advance.
- Mark as New
- Bookmark Message
- Subscribe to Message
- Mute Message
- Subscribe to RSS Feed
- Permalink
- Report Inappropriate Content
Please share your current query and explain why you think timechart is not accurate.
If this reply helps you, Karma would be appreciated.
- Mark as New
- Bookmark Message
- Subscribe to Message
- Mute Message
- Subscribe to RSS Feed
- Permalink
- Report Inappropriate Content
So I have results that I get is 1300+ for a day. I want to report a daily chart of the statistcs.
I have included the screenshot where I tried timechart dest, But the result I'm seeing there would be spreading all the dest over the report and counting it. All I want is overall dest count for a day, So I can show the trend.
Thanks.
- Mark as New
- Bookmark Message
- Subscribe to Message
- Mute Message
- Subscribe to RSS Feed
- Permalink
- Report Inappropriate Content
In general, if timechart gives unexpected results then you should blame your query rather than timechart.
For instance, it makes little sense to use dedup before timechart count because your counts will all be 1.
If this reply helps you, Karma would be appreciated.

Join the Splunk Community Slack to learn, troubleshoot, and make connections with fellow Splunk practitioners in real time!
Join Splunk User Groups to connect and learn in-person by region or remotely by topic or industry.
Deep Dive: Accelerate threat investigation with Splunk’s AI Assistant in Security
Announcing Modern Navigation: A New Era of Splunk User Experience
Detection Engineering Office Hours: Real-World Troubleshooting & Q&A
