
Join the Conversation
- Find Answers
- :
- Using Splunk
- :
- Splunk Search
- :
- Re: How to sum float value in stats
- Subscribe to RSS Feed
- Mark Topic as New
- Mark Topic as Read
- Float this Topic for Current User
- Bookmark Topic
- Subscribe to Topic
- Mute Topic
- Printer Friendly Page
- Mark as New
- Bookmark Message
- Subscribe to Message
- Mute Message
- Subscribe to RSS Feed
- Permalink
- Report Inappropriate Content

I have that field "numberOfDays" that I have created that returns values of number of days in float type (0.345, 1.435 ...).
I would like to sum the results grouped by number(just like the excel example). In the following code it returns the count of occurrences.
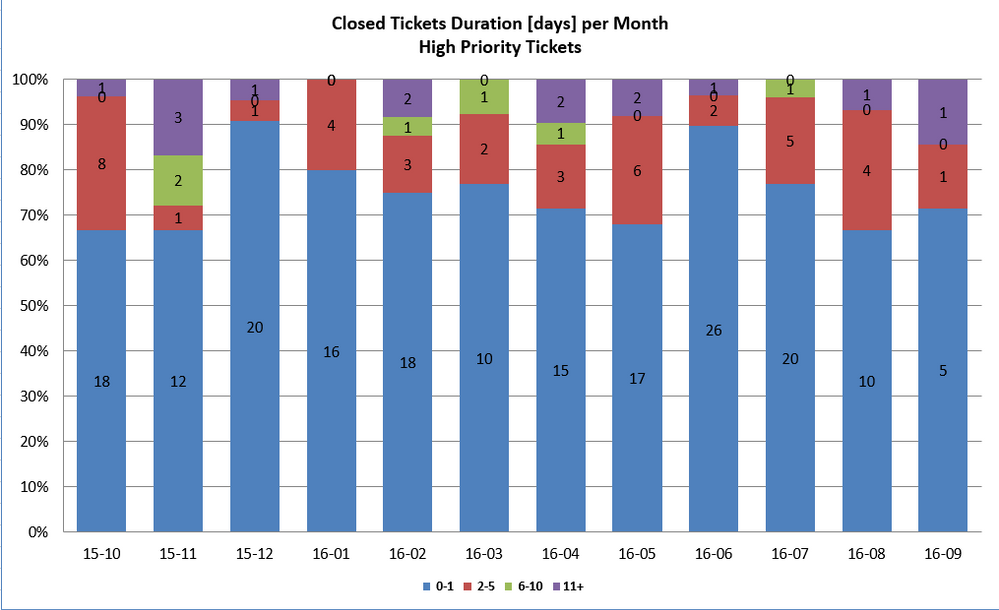
The code I am using:
    index=snow assignment_group_name=*israel* dv_state="Clos*" priority=2
    | dedup number
    | eval month = substr(substr(sys_updated_on,6,7),1,2)
    | eval year = substr(substr(sys_updated_on,3,4),1,2)
    | eval timeField = year+"."+month
    | rex field=dv_u_total_time_spent "(?<DAYS>\d+)\s*Day"
    | rex field=dv_u_total_time_spent "(?<HOURS>\d+)\s*Hour"
    | rex field=dv_u_total_time_spent "(?<MINS>\d+)\s*Minute"
    | eval DAYS = if((isnull(DAYS)), 0, tonumber(DAYS))
    | eval HOURS = if((isnull(HOURS)), 0, tonumber(HOURS))
    | eval MINS = if((isnull(MINS)), 0, tonumber(MINS))
    | eval numberOfDays = round(DAYS) + round(HOURS/8,3) + round(MINS/480,3)
    | replace OTHER with 0 in numberOfDays
    | table number sys_updated_on month year timeField DAYS HOURS MINS numberOfDays
    | chart sum(eval(numberOfDays<2)) as "0-1" sum(eval(numberOfDays>1 AND numberOfDays<6)) as "2-5" sum(eval(numberOfDays>5 AND numberOfDays<11)) as "6-10" sum(eval(numberOfDays>10)) as "11+" over timeField by numberOfDays
Result graph:
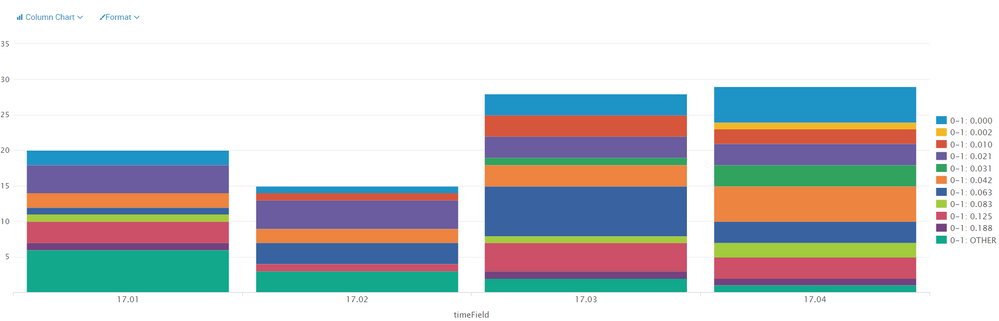
Also, the result graph shows extra data in the legend. and I need it to be like the excel.
What am I doing wrong?
Thank you
- Mark as New
- Bookmark Message
- Subscribe to Message
- Mute Message
- Subscribe to RSS Feed
- Permalink
- Report Inappropriate Content

You are keeping accuracy that you won't be using in the reporting. This will get rid of most of the banding:
| eval numberOfDays = round(DAYS + HOURS/8 +MINS/480,0)
to get rid of it all, you need to change more lines. This is a quick aircode version...
 | eval numberOfDays = round(DAYS) + HOURS/8 +MINS/1440,0)
 | eval numberOfDays=case(numberOfDays,"0-1",numberOfDays<6,"2-5", numberOfDays<11,"6-10",true(),"11+")
 | chart count over timeField by numberOfDays
- Mark as New
- Bookmark Message
- Subscribe to Message
- Mute Message
- Subscribe to RSS Feed
- Permalink
- Report Inappropriate Content
You are keeping accuracy that you won't be using in the reporting. This will get rid of most of the banding:
| eval numberOfDays = round(DAYS + HOURS/8 +MINS/480,0)
to get rid of it all, you need to change more lines. This is a quick aircode version...
 | eval numberOfDays = round(DAYS) + HOURS/8 +MINS/1440,0)
 | eval numberOfDays=case(numberOfDays,"0-1",numberOfDays<6,"2-5", numberOfDays<11,"6-10",true(),"11+")
 | chart count over timeField by numberOfDays




Join the Splunk Community Slack to learn, troubleshoot, and make connections with fellow Splunk practitioners in real time!
Join Splunk User Groups to connect and learn in-person by region or remotely by topic or industry.
Painting a Clearer Picture: Unifying Your Investigations with Cisco AI Canvas
Hello POJO, meet nocode
Announcing Modern Navigation: A New Era of Splunk User Experience
