Are you a member of the Splunk Community?
- Find Answers
- :
- Using Splunk
- :
- Splunk Search
- :
- Re: How to display search DEBUG messages in Job In...
- Subscribe to RSS Feed
- Mark Topic as New
- Mark Topic as Read
- Float this Topic for Current User
- Bookmark Topic
- Subscribe to Topic
- Mute Topic
- Printer Friendly Page
- Mark as New
- Bookmark Message
- Subscribe to Message
- Mute Message
- Subscribe to RSS Feed
- Permalink
- Report Inappropriate Content
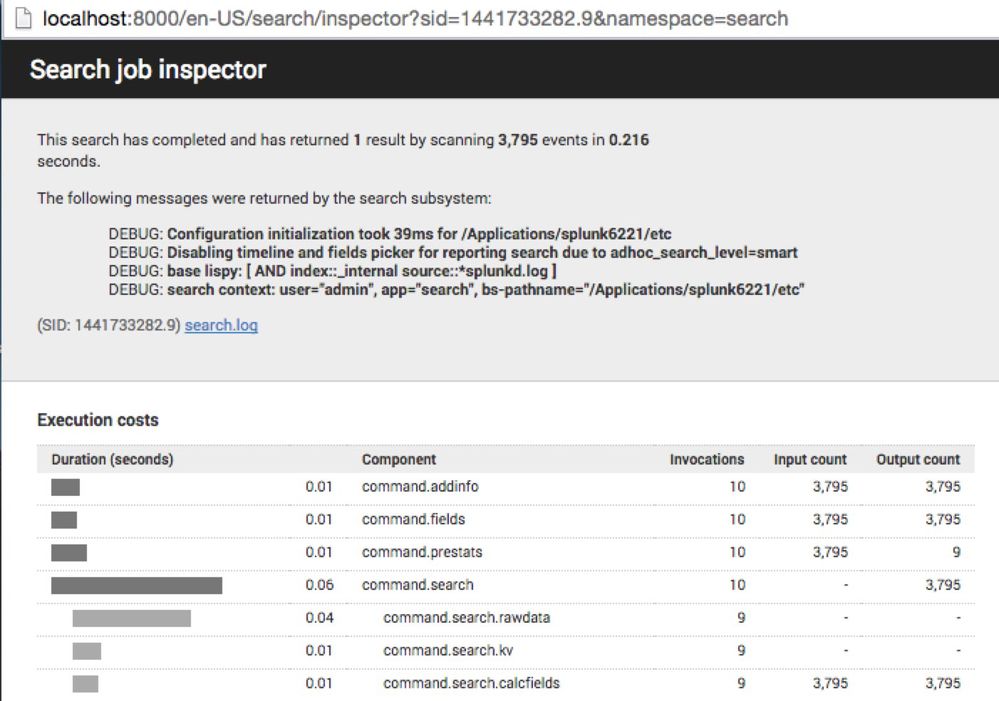
Looking to how to enable the message block starting with "The following messages were returned by the search subsystem:" and the DEBUG messages that follow. (I've seen INFO and WARN also displayed.)
- Mark as New
- Bookmark Message
- Subscribe to Message
- Mute Message
- Subscribe to RSS Feed
- Permalink
- Report Inappropriate Content
There are two different ways of recording a message for a search in splunk 6.2 (and perhaps in future releases as well): Logging and "Info Messages". Both subscribe to the DEBUG/INFO/WARN/ERROR categorization. Logging only shows up in search.log and is configured via ./etc/log-searchprocess.cfg. "Info Messages" are stored in info.csv. The controls are in limits.conf that allow you to cap both the number and severity level. The defaults are set to 20 messages and INFO level only.
I have tested with the following, and was seeing DEBUG messages in the job inspector UI:
# ./etc/system/local/limits.conf
[search_info]
# These setting control logging of error messages to info.csv
# All messages will be logged to search.log regardless of these settings.
# maximum number of error messages to log in info.csv
# Set to 0 to remove limit, may affect search performance
max_infocsv_messages = 0
# log level = DEBUG | INFO | WARN | ERROR
infocsv_log_level = DEBUG
- Mark as New
- Bookmark Message
- Subscribe to Message
- Mute Message
- Subscribe to RSS Feed
- Permalink
- Report Inappropriate Content
In Splunk 6.4, you probably want to do this in etc/system/local/limits.conf
[search_metrics]
debug_metrics = true
From limits.conf.spec
[search_metrics]
debug_metrics = <bool>
* This indicates whether we should output more detailed search metrics for
  debugging.
* This will do things like break out where the time was spent by peer, and may
  add additional deeper levels of metrics.
* This is NOT related to "metrics.log" but to the "Execution Costs" and
  "Performance" fields in the Search inspector, or the count_map in info.csv.
* Defaults to false
- Mark as New
- Bookmark Message
- Subscribe to Message
- Mute Message
- Subscribe to RSS Feed
- Permalink
- Report Inappropriate Content
hello lguinn,
I am able to see those warnings and errors in splunk GUI but am unable to access them through splunk java sdk is there any way to access through job in java?
*Splunk documentation shows that there is a property called messages in job but i couldn't able to find it in my sdk.
Please help me out.
thanks,
- Mark as New
- Bookmark Message
- Subscribe to Message
- Mute Message
- Subscribe to RSS Feed
- Permalink
- Report Inappropriate Content
There are two different ways of recording a message for a search in splunk 6.2 (and perhaps in future releases as well): Logging and "Info Messages". Both subscribe to the DEBUG/INFO/WARN/ERROR categorization. Logging only shows up in search.log and is configured via ./etc/log-searchprocess.cfg. "Info Messages" are stored in info.csv. The controls are in limits.conf that allow you to cap both the number and severity level. The defaults are set to 20 messages and INFO level only.
I have tested with the following, and was seeing DEBUG messages in the job inspector UI:
# ./etc/system/local/limits.conf
[search_info]
# These setting control logging of error messages to info.csv
# All messages will be logged to search.log regardless of these settings.
# maximum number of error messages to log in info.csv
# Set to 0 to remove limit, may affect search performance
max_infocsv_messages = 0
# log level = DEBUG | INFO | WARN | ERROR
infocsv_log_level = DEBUG
- Mark as New
- Bookmark Message
- Subscribe to Message
- Mute Message
- Subscribe to RSS Feed
- Permalink
- Report Inappropriate Content
Hello SplunkIT,
I am able to see those warnings and errors in splunk GUI but am unable to access them through splunk java sdk is there any way to access through job in java?
*Splunk documentation shows that there is a property called messages in job but i couldn't able to find it in my sdk.
Please help me out.
thanks,

