Turn on suggestions
Auto-suggest helps you quickly narrow down your search results by suggesting possible matches as you type.
Splunk Search
×
Join the Conversation
Without signing in, you're just watching from the sidelines. Sign in or Register to connect, share, and be part of the Splunk Community.
Turn on suggestions
Auto-suggest helps you quickly narrow down your search results by suggesting possible matches as you type.
- Find Answers
- :
- Using Splunk
- :
- Splunk Search
- :
- Re: TimeChart for average function avg()
Options
- Subscribe to RSS Feed
- Mark Topic as New
- Mark Topic as Read
- Float this Topic for Current User
- Bookmark Topic
- Subscribe to Topic
- Mute Topic
- Printer Friendly Page
- Mark as New
- Bookmark Message
- Subscribe to Message
- Mute Message
- Subscribe to RSS Feed
- Permalink
- Report Inappropriate Content
DPOIRE
Path Finder
03-28-2023
07:26 AM
I have this search that is working and returning a average Delay value:
Search Command
| eval epoch_timestamp=strptime(timestamp,"%Y-%m-%dT%H:%M:%S.%3N%:z")
| stats range(epoch_timestamp) as Delay by "logId"
| stats avg(Delay)
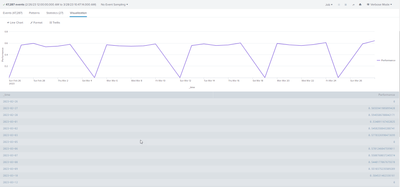
However, I want to display the daily averages in a timechart graph to see the performance evolution by day.
Tried the following based on research but It does not return Statistic or Vizualization values (just returning events):
Search Command
| eval epoch_timestamp=strptime(timestamp,"%Y-%m-%dT%H:%M:%S.%3N%:z")
| stats range(epoch_timestamp) as Delay by "logId"
| bucket _time span=1d
| stats avg(Delay) as Performance by _time
1 Solution
- Mark as New
- Bookmark Message
- Subscribe to Message
- Mute Message
- Subscribe to RSS Feed
- Permalink
- Report Inappropriate Content
ITWhisperer

SplunkTrust
03-28-2023
08:14 AM
- Mark as New
- Bookmark Message
- Subscribe to Message
- Mute Message
- Subscribe to RSS Feed
- Permalink
- Report Inappropriate Content
DPOIRE
Path Finder
03-28-2023
07:53 AM
Thanks, appears to partially work.
You provided the solution to my question.
However, I have this result now where Sunday is returning a zero value which is screwing up the results and trend.
How can I remove these from the results and graph?
- Mark as New
- Bookmark Message
- Subscribe to Message
- Mute Message
- Subscribe to RSS Feed
- Permalink
- Report Inappropriate Content
ITWhisperer

SplunkTrust
03-28-2023
08:14 AM
| eval Performance=if(Performance == 0,null(),Performance)
- Mark as New
- Bookmark Message
- Subscribe to Message
- Mute Message
- Subscribe to RSS Feed
- Permalink
- Report Inappropriate Content
ITWhisperer

SplunkTrust
03-28-2023
07:31 AM
Try something by this
| eval epoch_timestamp=strptime(timestamp,"%Y-%m-%dT%H:%M:%S.%3N%:z")
| stats range(epoch_timestamp) as Delay max(_time) as _time by "logId"
| bucket _time span=1d
| stats avg(Delay) as Performance by _time
Get Updates on the Splunk Community!
Data Management Digest – December 2025
Welcome to the December edition of Data Management Digest!
As we continue our journey of data innovation, the ...
Index This | What is broken 80% of the time by February?
December 2025 Edition
Hayyy Splunk Education Enthusiasts and the Eternally Curious!
We’re back with this ...
Unlock Faster Time-to-Value on Edge and Ingest Processor with New SPL2 Pipeline ...
Hello Splunk Community,
We're thrilled to share an exciting update that will help you manage your data more ...


