
Join the Conversation
- Find Answers
- :
- Using Splunk
- :
- Splunk Search
- :
- Re: How do I have a single Total column without ad...
- Subscribe to RSS Feed
- Mark Topic as New
- Mark Topic as Read
- Float this Topic for Current User
- Bookmark Topic
- Subscribe to Topic
- Mute Topic
- Printer Friendly Page
- Mark as New
- Bookmark Message
- Subscribe to Message
- Mute Message
- Subscribe to RSS Feed
- Permalink
- Report Inappropriate Content

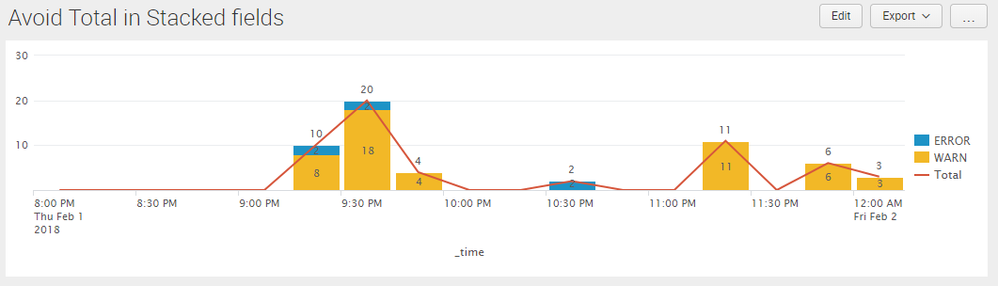
I have created a nice stacked timechart that I would like to see the Totals of in the table under the chart. The addtotals command adds the Total column (as wanted), but it also adds the Total to the stacked chart. Therefore, each stacked chart column is doubled. How do I have a Total column without adding it to the stacked chart?
- Mark as New
- Bookmark Message
- Subscribe to Message
- Mute Message
- Subscribe to RSS Feed
- Permalink
- Report Inappropriate Content

@shargrave, one of the options would be to have the chart as Column Chart and set Total as Overlay Field in the chart. That way total will show up as Line Overlay Series and will not stack.
<option name="charting.chart.overlayFields">Total</option>
Following is the run anywhere dashboard example:
<dashboard>
  <label>Avoid Total in Stacked fields</label>
  <row>
    <panel>
      <chart>
        <search>
          <query>index=_internal sourcetype=splunkd log_level!="INFO" component!="Conf*"
| timechart span=15m count by log_level
| addtotals row=t col=f</query>
          <earliest>-4h@m</earliest>
          <latest>now</latest>
          <sampleRatio>1</sampleRatio>
        </search>
        <option name="charting.axisLabelsX.majorLabelStyle.overflowMode">ellipsisNone</option>
        <option name="charting.axisLabelsX.majorLabelStyle.rotation">0</option>
        <option name="charting.axisTitleX.visibility">visible</option>
        <option name="charting.axisTitleY.visibility">visible</option>
        <option name="charting.axisTitleY2.visibility">visible</option>
        <option name="charting.axisX.abbreviation">none</option>
        <option name="charting.axisX.scale">linear</option>
        <option name="charting.axisY.abbreviation">none</option>
        <option name="charting.axisY.scale">linear</option>
        <option name="charting.axisY2.abbreviation">none</option>
        <option name="charting.axisY2.enabled">0</option>
        <option name="charting.axisY2.scale">inherit</option>
        <option name="charting.chart">column</option>
        <option name="charting.chart.bubbleMaximumSize">50</option>
        <option name="charting.chart.bubbleMinimumSize">10</option>
        <option name="charting.chart.bubbleSizeBy">area</option>
        <option name="charting.chart.nullValueMode">gaps</option>
        <option name="charting.chart.overlayFields">Total</option>
        <option name="charting.chart.showDataLabels">all</option>
        <option name="charting.chart.sliceCollapsingThreshold">0.01</option>
        <option name="charting.chart.stackMode">stacked</option>
        <option name="charting.chart.style">shiny</option>
        <option name="charting.drilldown">none</option>
        <option name="charting.layout.splitSeries">0</option>
        <option name="charting.layout.splitSeries.allowIndependentYRanges">0</option>
        <option name="charting.legend.labelStyle.overflowMode">ellipsisEnd</option>
        <option name="charting.legend.mode">standard</option>
        <option name="charting.legend.placement">right</option>
        <option name="charting.lineWidth">2</option>
        <option name="trellis.enabled">0</option>
        <option name="trellis.scales.shared">1</option>
        <option name="trellis.size">medium</option>
      </chart>
    </panel>
  </row>
</dashboard>
| makeresults | eval message= "Happy Splunking!!!"
- Mark as New
- Bookmark Message
- Subscribe to Message
- Mute Message
- Subscribe to RSS Feed
- Permalink
- Report Inappropriate Content
@shargrave, one of the options would be to have the chart as Column Chart and set Total as Overlay Field in the chart. That way total will show up as Line Overlay Series and will not stack.
<option name="charting.chart.overlayFields">Total</option>
Following is the run anywhere dashboard example:
<dashboard>
  <label>Avoid Total in Stacked fields</label>
  <row>
    <panel>
      <chart>
        <search>
          <query>index=_internal sourcetype=splunkd log_level!="INFO" component!="Conf*"
| timechart span=15m count by log_level
| addtotals row=t col=f</query>
          <earliest>-4h@m</earliest>
          <latest>now</latest>
          <sampleRatio>1</sampleRatio>
        </search>
        <option name="charting.axisLabelsX.majorLabelStyle.overflowMode">ellipsisNone</option>
        <option name="charting.axisLabelsX.majorLabelStyle.rotation">0</option>
        <option name="charting.axisTitleX.visibility">visible</option>
        <option name="charting.axisTitleY.visibility">visible</option>
        <option name="charting.axisTitleY2.visibility">visible</option>
        <option name="charting.axisX.abbreviation">none</option>
        <option name="charting.axisX.scale">linear</option>
        <option name="charting.axisY.abbreviation">none</option>
        <option name="charting.axisY.scale">linear</option>
        <option name="charting.axisY2.abbreviation">none</option>
        <option name="charting.axisY2.enabled">0</option>
        <option name="charting.axisY2.scale">inherit</option>
        <option name="charting.chart">column</option>
        <option name="charting.chart.bubbleMaximumSize">50</option>
        <option name="charting.chart.bubbleMinimumSize">10</option>
        <option name="charting.chart.bubbleSizeBy">area</option>
        <option name="charting.chart.nullValueMode">gaps</option>
        <option name="charting.chart.overlayFields">Total</option>
        <option name="charting.chart.showDataLabels">all</option>
        <option name="charting.chart.sliceCollapsingThreshold">0.01</option>
        <option name="charting.chart.stackMode">stacked</option>
        <option name="charting.chart.style">shiny</option>
        <option name="charting.drilldown">none</option>
        <option name="charting.layout.splitSeries">0</option>
        <option name="charting.layout.splitSeries.allowIndependentYRanges">0</option>
        <option name="charting.legend.labelStyle.overflowMode">ellipsisEnd</option>
        <option name="charting.legend.mode">standard</option>
        <option name="charting.legend.placement">right</option>
        <option name="charting.lineWidth">2</option>
        <option name="trellis.enabled">0</option>
        <option name="trellis.scales.shared">1</option>
        <option name="trellis.size">medium</option>
      </chart>
    </panel>
  </row>
</dashboard>
| makeresults | eval message= "Happy Splunking!!!"
- Mark as New
- Bookmark Message
- Subscribe to Message
- Mute Message
- Subscribe to RSS Feed
- Permalink
- Report Inappropriate Content
Thank you. That does work, although the result is a little ugly. This really seems like a bug, as I'm not sure why you would ever want to add the total to the stacked chart?



Join the Splunk Community Slack to learn, troubleshoot, and make connections with fellow Splunk practitioners in real time!
Join Splunk User Groups to connect and learn in-person by region or remotely by topic or industry.
SOC4Kafka - New Kafka Connector Powered by OpenTelemetry
Rounding off the Splunk Dashboard Contest
A Four Part Event Series: AI + Observability: AI Agents, LLMs, Apps, & Infrastructure
