
Join the Conversation
- Find Answers
- :
- Using Splunk
- :
- Splunk Search
- :
- Error in 'eval' command: The expression is malform...
- Subscribe to RSS Feed
- Mark Topic as New
- Mark Topic as Read
- Float this Topic for Current User
- Bookmark Topic
- Subscribe to Topic
- Mute Topic
- Printer Friendly Page
- Mark as New
- Bookmark Message
- Subscribe to Message
- Mute Message
- Subscribe to RSS Feed
- Permalink
- Report Inappropriate Content

<query>"$ps_fn$" |rex field=message "(?<Http>HttpStatus): (?<status>\\d+)" | eval status=(status, "4%"),"4xx" | stats count by status</query>
<earliest>$time.earliest$</earliest>
<latest>$time.latest$</latest>
I am trying to make a pie chart that shows all the 4xx errors, and then breaks them out by error - so x% was 401, y% was 402, etc.
But i am getting Error in 'eval' command: The expression is malformed. Expected ). when i run this on the dashboard.
- Mark as New
- Bookmark Message
- Subscribe to Message
- Mute Message
- Subscribe to RSS Feed
- Permalink
- Report Inappropriate Content


Can you please try this?
<query>"$ps_fn$" |rex field=message "(?<Http>HttpStatus): (?<status>\\d+)" | where like(status,"4%") | stats count by status</query>
<earliest>$time.earliest$</earliest>
<latest>$time.latest$</latest>
Thanks
KV
▄︻̷̿┻̿═━一
If any of my reply helps you to solve the problem Or gain knowledge, an upvote would be appreciated.
- Mark as New
- Bookmark Message
- Subscribe to Message
- Mute Message
- Subscribe to RSS Feed
- Permalink
- Report Inappropriate Content

What is this
eval status=(status, "4%"),"4xx"trying to do?
Also, I am not sure you need to escape the backslash in the rex as you are probably trying to escape the d and I expect you don't really need a field that always has the text "HttpStatus" in
rex field=message "HttpStatus: (?<status>\d+)"
- Mark as New
- Bookmark Message
- Subscribe to Message
- Mute Message
- Subscribe to RSS Feed
- Permalink
- Report Inappropriate Content
@ITWhisperer wrote:What is this
eval status=(status, "4%"),"4xx"
trying to do?
Also, I am not sure you need to escape the backslash in the rex as you are probably trying to escape the d and I expect you don't really need a field that always has the text "HttpStatus" in
rex field=message "HttpStatus: (?<status>\d+)"
I'm not sure I understand.
To clarify what the query is intending to do overall is
Search for a specific API, return all status codes of a specific type, display them in a piechart by % :

This is using the solution provided by @kamlesh_vaghela
- Mark as New
- Bookmark Message
- Subscribe to Message
- Mute Message
- Subscribe to RSS Feed
- Permalink
- Report Inappropriate Content
Can you please try this?
<query>"$ps_fn$" |rex field=message "(?<Http>HttpStatus): (?<status>\\d+)" | where like(status,"4%") | stats count by status</query>
<earliest>$time.earliest$</earliest>
<latest>$time.latest$</latest>
Thanks
KV
▄︻̷̿┻̿═━一
If any of my reply helps you to solve the problem Or gain knowledge, an upvote would be appreciated.
- Mark as New
- Bookmark Message
- Subscribe to Message
- Mute Message
- Subscribe to RSS Feed
- Permalink
- Report Inappropriate Content
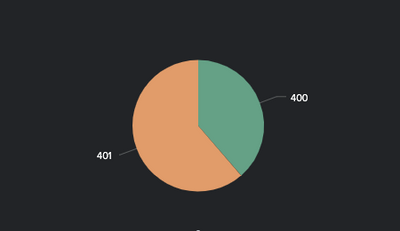
Confirmed this worked! Thank you!
- Mark as New
- Bookmark Message
- Subscribe to Message
- Mute Message
- Subscribe to RSS Feed
- Permalink
- Report Inappropriate Content
<query>"$ps_fn$" |rex field=message "(?<Http>HttpStatus): (?<status>\\d+)" | eval ActResult=case(status=400, "400", status=401, "401", status=402, "402", status=403, "403", status=404, "404") | stats count by ActResult | eval ActResult = count+" : "+ActResult</query>Is it better to do it like this?

Join the Splunk Community Slack to learn, troubleshoot, and make connections with fellow Splunk practitioners in real time!
Join Splunk User Groups to connect and learn in-person by region or remotely by topic or industry.
Tuning Edge Processor in Hybrid Mode: What Limits Each Data Path
Best Practices: Splunk auto adjust pipeline queue
Request for Professional Development: Attending .conf26
