
Join the Conversation
- Find Answers
- :
- Using Splunk
- :
- Splunk Search
- :
- Re: Chart overlay is invisbile
- Subscribe to RSS Feed
- Mark Topic as New
- Mark Topic as Read
- Float this Topic for Current User
- Bookmark Topic
- Subscribe to Topic
- Mute Topic
- Printer Friendly Page
- Mark as New
- Bookmark Message
- Subscribe to Message
- Mute Message
- Subscribe to RSS Feed
- Permalink
- Report Inappropriate Content
Chart overlay is invisbile

Hi,
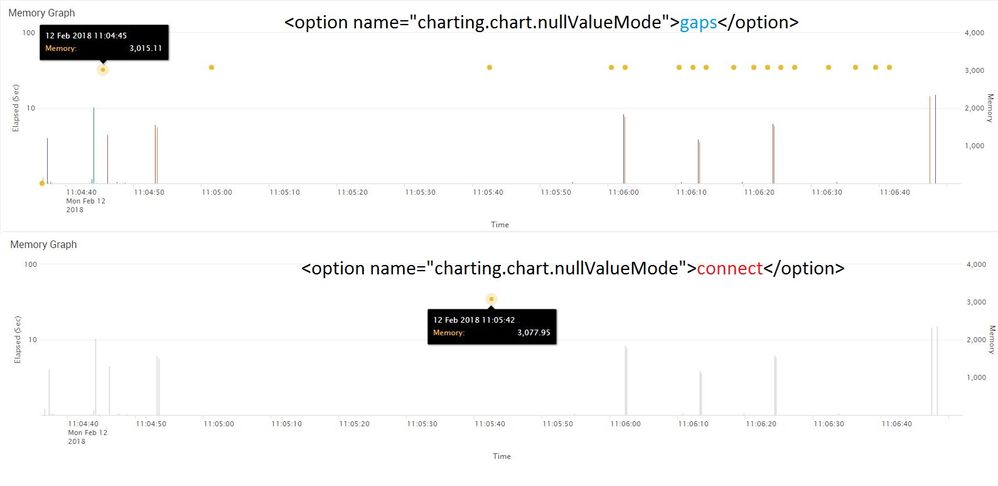
I am using line chart overlay on column chart. but It's not displaying overlay line chart, even though data points are present. When I hover the mouse, I can see all data points.
When I use charting.chart.nullValueMode = gaps , It display all data points as bubble.
<option name="charting.chart.nullValueMode">gaps</option>
And charting.chart.nullValueMode = connect, won't display overlay chart.
<option name="charting.chart.nullValueMode">connect</option>
It there any other option to make line chart visible ?
Query:
| tstats summariesonly=true max(MXTIMING.Elapsed) AS Elapsed FROM datamodel=MXTIMING_V3 WHERE source="$MXTIMING_FULL_FILE_token$" GROUPBY MXTIMING.Context+Command MXTIMING.Time _time | rename MXTIMING.Context+Command as Context+Command | rename MXTIMING.Time as Time | timechart bins=1000 max(Elapsed) by Context+Command | appendcols [ | tstats summariesonly=true max(MXTIMING.Memory) AS Memory FROM datamodel=MXTIMING_V3 WHERE source="$MXTIMING_FULL_FILE_token$" GROUPBY MXTIMING.Context+Command MXTIMING.Time _time | timechart bins=1000 max(Memory) as Memory ]
Thanks
- Mark as New
- Bookmark Message
- Subscribe to Message
- Mute Message
- Subscribe to RSS Feed
- Permalink
- Report Inappropriate Content

have you tried <option name="charting.chart.nullValueMode">zero</option>
- Mark as New
- Bookmark Message
- Subscribe to Message
- Mute Message
- Subscribe to RSS Feed
- Permalink
- Report Inappropriate Content
not working. It just showing bubble if value is zero.
- Mark as New
- Bookmark Message
- Subscribe to Message
- Mute Message
- Subscribe to RSS Feed
- Permalink
- Report Inappropriate Content

@agoyal did you ever find the answer for this??? even i am facing the same issue.
- Mark as New
- Bookmark Message
- Subscribe to Message
- Mute Message
- Subscribe to RSS Feed
- Permalink
- Report Inappropriate Content
Hi,
Can you try adding following parameter below nullValueMode = connect:
<option name="charting.chart.showMarkers">true</option>
- Mark as New
- Bookmark Message
- Subscribe to Message
- Mute Message
- Subscribe to RSS Feed
- Permalink
- Report Inappropriate Content
After adding this chart is showing only bubbles at data points , no line to connect them.



Join the Splunk Community Slack to learn, troubleshoot, and make connections with fellow Splunk practitioners in real time!
Join Splunk User Groups to connect and learn in-person by region or remotely by topic or industry.
A Four-Part Event Series: Full Stack Observability For the AI Era
SOC4Kafka - New Kafka Connector Powered by OpenTelemetry
Event Series: Level up your SOC: Advancing with Splunk Enterprise Security
