
Join the Conversation
- Find Answers
- :
- Splunk Products
- :
- Splunk Enterprise
- :
- Re: Create a Line-Chart from an Array within a Sin...
- Subscribe to RSS Feed
- Mark Topic as New
- Mark Topic as Read
- Float this Topic for Current User
- Bookmark Topic
- Subscribe to Topic
- Mute Topic
- Printer Friendly Page
- Mark as New
- Bookmark Message
- Subscribe to Message
- Mute Message
- Subscribe to RSS Feed
- Permalink
- Report Inappropriate Content

- Mark as New
- Bookmark Message
- Subscribe to Message
- Mute Message
- Subscribe to RSS Feed
- Permalink
- Report Inappropriate Content


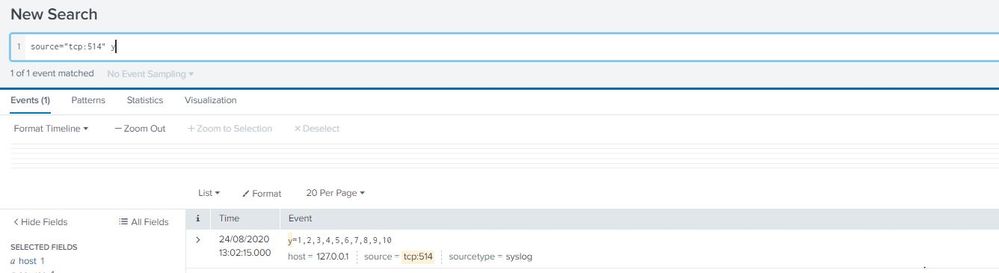
The first part just generates some data, but you already have your events sent from matlab in the _raw field (the column is displayed as Events but the data is in a field called _raw). Your full query should look something like this:
source="tcp:515"
| streamstats count as row
| fields row, _raw
| rex field=_raw "y=(?<y>.*)"
| makemv delim="," y
| eval size=mvcount(y)
| eval index=mvrange(0, size, 1)
| eval xy=mvzip(index, y)
| mvexpand xy
| rex field=xy "(?<x>[^,]),(?<y>.*)"
| fields x,y,row
| chart values(y) as y by x, row
- Mark as New
- Bookmark Message
- Subscribe to Message
- Mute Message
- Subscribe to RSS Feed
- Permalink
- Report Inappropriate Content
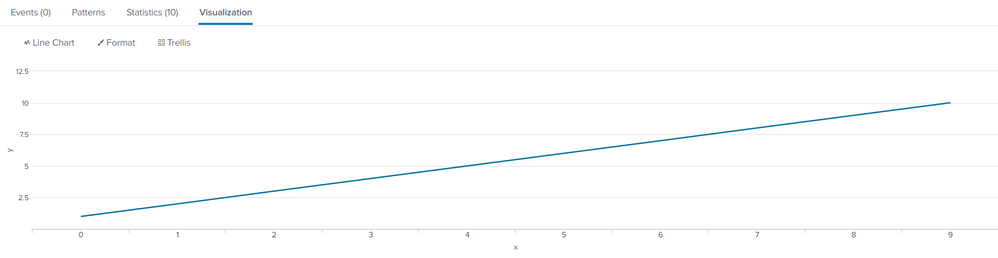
Not sure if y is your data or your index - assuming it is data, then you need to split your data into a multi-value field and combine it with the index of the element, and split that into your x and y e.g.
| makeresults
| eval log="y=1,2,3,4,5,6,7,8,9,10"
| rex field=log "y=(?<y>.*)"
| makemv delim="," y
| eval size=mvcount(y)
| eval index=mvrange(0, size, 1)
| eval xy=mvzip(index, y)
| mvexpand xy
| rex field=xy "(?<x>[^,]),(?<y>.*)"
| fields x,y
There is probably a more elegant way of doing this!
- Mark as New
- Bookmark Message
- Subscribe to Message
- Mute Message
- Subscribe to RSS Feed
- Permalink
- Report Inappropriate Content
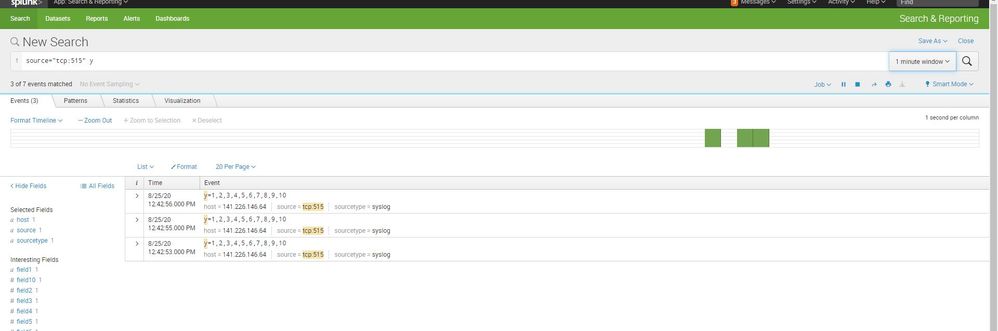
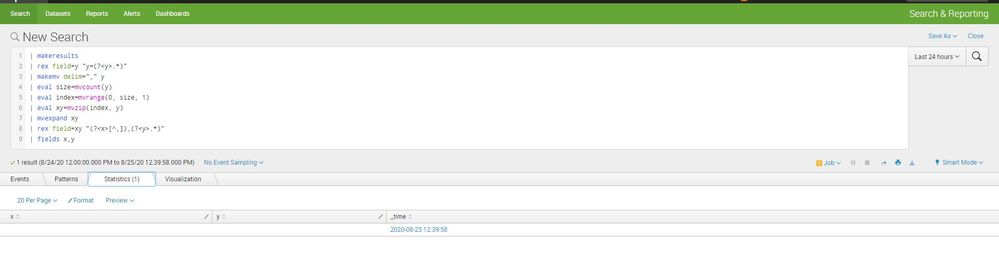
what i need to add instead of "| eval log="y=1,2,3,4,5,6,7,8,9,10" ?
if i delete this line, it not work.
thanks
- Mark as New
- Bookmark Message
- Subscribe to Message
- Mute Message
- Subscribe to RSS Feed
- Permalink
- Report Inappropriate Content
The first 3 lines just create a result that I can work with (I don't have your data!)
Assuming you haven't already parsed your log into fields, you need to apply the rex to the _raw field
| rex field=_raw "y=(?<y>.*)"- Mark as New
- Bookmark Message
- Subscribe to Message
- Mute Message
- Subscribe to RSS Feed
- Permalink
- Report Inappropriate Content
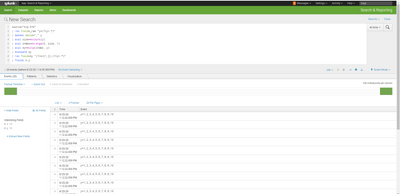
still its not visualization
thanks for the help
- Mark as New
- Bookmark Message
- Subscribe to Message
- Mute Message
- Subscribe to RSS Feed
- Permalink
- Report Inappropriate Content
It is not clear what visualisation you want - do you want a line for each original row of your data? does each row have a unique timestamp or some other way of identifying it?
- Mark as New
- Bookmark Message
- Subscribe to Message
- Mute Message
- Subscribe to RSS Feed
- Permalink
- Report Inappropriate Content
It is not clear what visualization you want - i want what you show in the first answer. y(x)
do you want a line for each original row of your data-i want line for each event > y=1,2,3...
does each row have a unique - no. i sent the data from matlab software (y=1,2...)
thanks
- Mark as New
- Bookmark Message
- Subscribe to Message
- Mute Message
- Subscribe to RSS Feed
- Permalink
- Report Inappropriate Content
In order to get a line for each event, you can add an additional field for the row number and chart by that
| makeresults
| eval event="y=1,2,3,4,5,6,7,8,9,10|y=2,3,4,5,6,7,8,9,10,11|y=3,4,5,6,7,8,9,10,11,12|y=4,5,6,7,8,9,10,11,12,13"
| makemv delim="|" event
| mvexpand event
| streamstats count as row
| fields row, event
| rex field=event "y=(?<y>.*)"
| makemv delim="," y
| eval size=mvcount(y)
| eval index=mvrange(0, size, 1)
| eval xy=mvzip(index, y)
| mvexpand xy
| rex field=xy "(?<x>[^,]),(?<y>.*)"
| fields x,y,row
| chart values(y) as y by x, row
To explain what is going on:
Create some dummy data (obviously, you don't need to do this)
| makeresults
| eval event="y=1,2,3,4,5,6,7,8,9,10|y=2,3,4,5,6,7,8,9,10,11|y=3,4,5,6,7,8,9,10,11,12|y=4,5,6,7,8,9,10,11,12,13"
| makemv delim="|" event
| mvexpand event
event is a field that represents your data.
Add a row number:
| streamstats count as row
| fields row, event
Create an array from the event data:
| rex field=event "y=(?<y>.*)"
| makemv delim="," y
Create an array of indexes (based on the size of array y):
| eval size=mvcount(y)
| eval index=mvrange(0, size, 1)
Zip the index and value together, and create an event for each:
| eval xy=mvzip(index, y)
| mvexpand xy
Split the index and value again and keep just the index, value and original row number
| rex field=xy "(?<x>[^,]),(?<y>.*)"
| fields x,y,row
Now, visualise y(x) for each row
| chart values(y) as y by x, row
- Mark as New
- Bookmark Message
- Subscribe to Message
- Mute Message
- Subscribe to RSS Feed
- Permalink
- Report Inappropriate Content
thanks for the explanation.
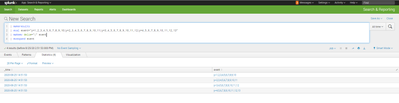
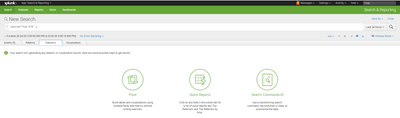
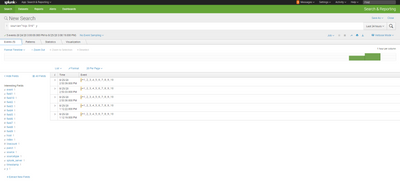
i think my mistake is on the first step:
when i search for y i see the event but cent do statistic like in your example
what is my mistake?
thanks
- Mark as New
- Bookmark Message
- Subscribe to Message
- Mute Message
- Subscribe to RSS Feed
- Permalink
- Report Inappropriate Content
The first part just generates some data, but you already have your events sent from matlab in the _raw field (the column is displayed as Events but the data is in a field called _raw). Your full query should look something like this:
source="tcp:515"
| streamstats count as row
| fields row, _raw
| rex field=_raw "y=(?<y>.*)"
| makemv delim="," y
| eval size=mvcount(y)
| eval index=mvrange(0, size, 1)
| eval xy=mvzip(index, y)
| mvexpand xy
| rex field=xy "(?<x>[^,]),(?<y>.*)"
| fields x,y,row
| chart values(y) as y by x, row
- Mark as New
- Bookmark Message
- Subscribe to Message
- Mute Message
- Subscribe to RSS Feed
- Permalink
- Report Inappropriate Content
Sorry, there was a mistake in this line
| rex field=xy "(?<x>[^,]),(?<y>.*)"It should have been:
| rex field=xy "(?<x>[^,]*),(?<y>.*)"This picks up values of x greater than 9 i.e. more than 1 digit
- Mark as New
- Bookmark Message
- Subscribe to Message
- Mute Message
- Subscribe to RSS Feed
- Permalink
- Report Inappropriate Content
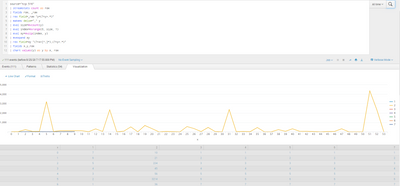
thank you so much😀
- Mark as New
- Bookmark Message
- Subscribe to Message
- Mute Message
- Subscribe to RSS Feed
- Permalink
- Report Inappropriate Content
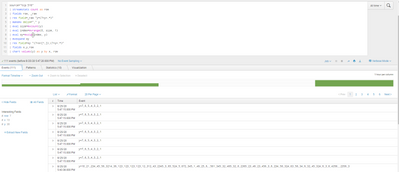
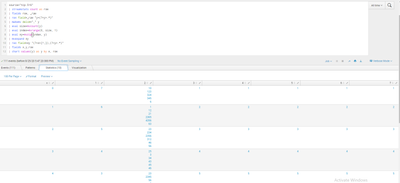
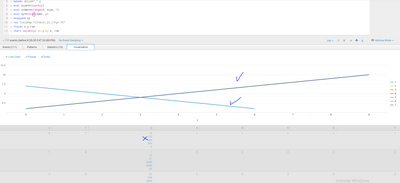
thank you. its work
if i tray to send 3 digit, i get strange results. please see the picture.

Join the Splunk Community Slack to learn, troubleshoot, and make connections with fellow Splunk practitioners in real time!
Join Splunk User Groups to connect and learn in-person by region or remotely by topic or industry.
[Puzzles] Solve, Learn, Reuse: Word-play
Tuning Edge Processor in Hybrid Mode: What Limits Each Data Path
Best Practices: Splunk auto adjust pipeline queue
