
Join the Conversation
- Find Answers
- :
- Using Splunk
- :
- Other Using Splunk
- :
- Reporting
- :
- Different bar color based on condition
- Subscribe to RSS Feed
- Mark Topic as New
- Mark Topic as Read
- Float this Topic for Current User
- Bookmark Topic
- Subscribe to Topic
- Mute Topic
- Printer Friendly Page
- Mark as New
- Bookmark Message
- Subscribe to Message
- Mute Message
- Subscribe to RSS Feed
- Permalink
- Report Inappropriate Content

Hi
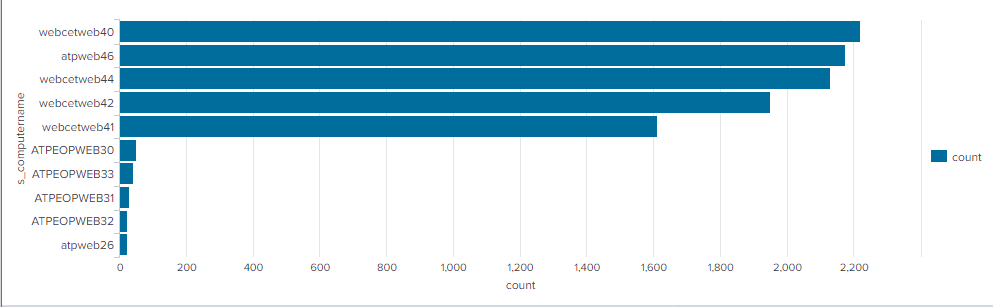
We have two sets of computers, one set is in 40s and another one set in 30s. When displaying chart I want to display both sets of computers in different specified color, one in blue colors and another in green colors.
Here is the chart that I am using
<chart>
<search>
<query>index=iis_prod | stats count by s_computername | sort - count | head 10</query>
<earliest>$field1.earliest$</earliest>
<latest>$field1.latest$</latest>
<sampleRatio>1</sampleRatio>
<refresh>10m</refresh>
<refreshType>delay</refreshType>
</search>
<option name="charting.axisLabelsX.majorLabelStyle.overflowMode">ellipsisNone</option>
<option name="charting.axisLabelsX.majorLabelStyle.rotation">0</option>
<option name="charting.axisTitleX.visibility">visible</option>
<option name="charting.axisTitleY.visibility">visible</option>
<option name="charting.axisTitleY2.visibility">visible</option>
<option name="charting.axisX.scale">linear</option>
<option name="charting.axisY.scale">linear</option>
<option name="charting.axisY2.enabled">0</option>
<option name="charting.axisY2.scale">inherit</option>
<option name="charting.chart">bar</option>
<option name="charting.chart.bubbleMaximumSize">50</option>
<option name="charting.chart.bubbleMinimumSize">10</option>
<option name="charting.chart.bubbleSizeBy">area</option>
<option name="charting.chart.nullValueMode">gaps</option>
<option name="charting.chart.showDataLabels">none</option>
<option name="charting.chart.sliceCollapsingThreshold">0.01</option>
<option name="charting.chart.stackMode">default</option>
<option name="charting.chart.style">shiny</option>
<option name="charting.drilldown">all</option>
<option name="charting.layout.splitSeries">0</option>
<option name="charting.layout.splitSeries.allowIndependentYRanges">0</option>
<option name="charting.legend.labelStyle.overflowMode">ellipsisMiddle</option>
<option name="charting.legend.placement">none</option>
<option name="height">225</option>
<option name="refresh.display">progressbar</option>
</chart>
I tried adding option called fieldColors to specific computer but it doesn't work
<option name="charting.fieldColors">{"webcetweb40":0x65a637}</option>
I tried adding option called seriesColors but that changes all of the bars
<option name="charting.seriesColors">[0x65a637]</option>
here is my bar chart screenshot.
Any help regarding this would be appreciated.
Thanks!
- Mark as New
- Bookmark Message
- Subscribe to Message
- Mute Message
- Subscribe to RSS Feed
- Permalink
- Report Inappropriate Content
Please refer to this URL.
try:
<row>
<panel>
<chart>
<search>
<query>index = _internal earliest=-h@h latest=@h
| stats count by sourcetype
| where sourcetype=="splunkd" OR sourcetype=="splunkd_access" OR sourcetype=="splunkd_remote_searches"
| eval splunkdCount = if(sourcetype=="splunkd",count,0)
| eval splunkd_accessCount = if(sourcetype=="splunkd_access",count,0)
| eval splunkd_remote_searches = if(sourcetype=="splunkd_remote_searches",count,0)
| fields - count</query>
<earliest>$earliest$</earliest>
<latest>$latest$</latest>
<sampleRatio>1</sampleRatio>
<refresh>10m</refresh>
<refreshType>delay</refreshType>
</search>
<option name="charting.chart">bar</option>
<option name="charting.chart.showDataLabels">all</option>
<option name="charting.chart.stackMode">stacked</option>
<option name="charting.drilldown">none</option>
<option name="charting.fieldColors">{"splunkdCount": #AF575A, "splunkd_accessCount": #EC9960, "splunkd_remote_searches":006D9C}</option>
<option name="charting.layout.splitSeries">0</option>
<option name="charting.legend.placement">bottom</option>
<option name="refresh.display">progressbar</option>
</chart>
</panel>
</row>

- Mark as New
- Bookmark Message
- Subscribe to Message
- Mute Message
- Subscribe to RSS Feed
- Permalink
- Report Inappropriate Content
Please refer to this URL.
try:
<row>
<panel>
<chart>
<search>
<query>index = _internal earliest=-h@h latest=@h
| stats count by sourcetype
| where sourcetype=="splunkd" OR sourcetype=="splunkd_access" OR sourcetype=="splunkd_remote_searches"
| eval splunkdCount = if(sourcetype=="splunkd",count,0)
| eval splunkd_accessCount = if(sourcetype=="splunkd_access",count,0)
| eval splunkd_remote_searches = if(sourcetype=="splunkd_remote_searches",count,0)
| fields - count</query>
<earliest>$earliest$</earliest>
<latest>$latest$</latest>
<sampleRatio>1</sampleRatio>
<refresh>10m</refresh>
<refreshType>delay</refreshType>
</search>
<option name="charting.chart">bar</option>
<option name="charting.chart.showDataLabels">all</option>
<option name="charting.chart.stackMode">stacked</option>
<option name="charting.drilldown">none</option>
<option name="charting.fieldColors">{"splunkdCount": #AF575A, "splunkd_accessCount": #EC9960, "splunkd_remote_searches":006D9C}</option>
<option name="charting.layout.splitSeries">0</option>
<option name="charting.legend.placement">bottom</option>
<option name="refresh.display">progressbar</option>
</chart>
</panel>
</row>


Join the Splunk Community Slack to learn, troubleshoot, and make connections with fellow Splunk practitioners in real time!
Join Splunk User Groups to connect and learn in-person by region or remotely by topic or industry.
SOC4Kafka - New Kafka Connector Powered by OpenTelemetry
Event Series: Level up your SOC: Advancing with Splunk Enterprise Security
Announcing Modern Navigation: A New Era of Splunk User Experience
