
Join the Conversation
- Find Answers
- :
- Splunk Administration
- :
- Getting Data In
- :
- Re: data sent repeatedly sent via syslog output
- Subscribe to RSS Feed
- Mark Topic as New
- Mark Topic as Read
- Float this Topic for Current User
- Bookmark Topic
- Subscribe to Topic
- Mute Topic
- Printer Friendly Page
- Mark as New
- Bookmark Message
- Subscribe to Message
- Mute Message
- Subscribe to RSS Feed
- Permalink
- Report Inappropriate Content

Every second or so splunk sends all the qualifying events it has see since it started plus any new events. Note: This replication is not showing up in the index, and is reset on a restart of indexers and forwarders (our deployment system restarts both
Here are my configs:
----------- forwarder inputs excerpt -----------
#Pick up the access logs as well as the Catalina out
[monitor::///somedir/tomcat5.5-logs]
_whitelist = \.(out|txt)$
disabled = false
followTail = 0

[monitor::///somedir/tomcat6.0/logs]
_whitelist = \.(out|txt|log)$
disabled = false
followTail = 0

----------- forwarder props excerpt -----------
#define sourcetype for both log types
[source::.../catalina.out]
sourcetype = log4j

[source::.../catalina_log.*.txt]
# the 5.5 and 6.0 use different extension (I just checked GRC and Native)
sourcetype = catalina_log

[source::.../catalina.*.log]
sourcetype = catalina_log

----------- server props excerpt -----------
#send log4j and catalina_log to named SyslogOut Transforms
[log4j]
\# … skipping lines
TRANSFORMS-routing=SyslogOut_log4j

[catalina_log]
TRANSFORMS-routing=SyslogOut_catalina_log

----------- server transforms excerpt -----------
#send SyslogOut Transforms to the corresponding syslog outputs
[SyslogOut_log4j]
REGEX=.*
DEST_KEY=_SYSLOG_ROUTING
FORMAT=SyslogOutAccess

[SyslogOut_catalina_log]
REGEX=.*
DEST_KEY=_SYSLOG_ROUTING
FORMAT=SyslogOutEvent

----------- server output except -----------
#send SyslogOut data via syslog Access to one host and log4j to another
[syslog]
disabled = false
indexAndForward = true
defaultGroup=SyslogOutEvent,SyslogOutAccess

[syslog:SyslogOutEvent]
type = tcp
server = MyHost02:516

[syslog:SyslogOutAccess]
type = tcp
server = MyHost01:516
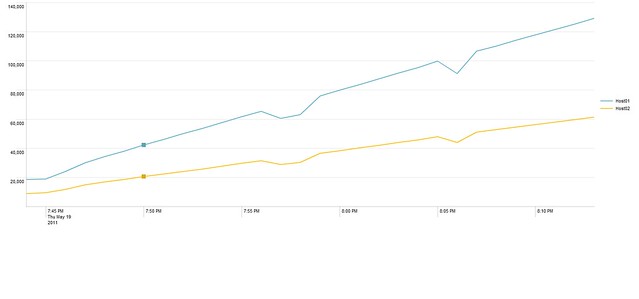
I used the following search to graph the issue:
latest=-2m@m earliest=-32m@m index="_internal" syslog Host* sourcetype="splunkd" _tcp_Kprocessed destIp | timechart span=1m per_minute(tcp_Kprocessed) by destIp
Here is the resulting graph:
?
- Mark as New
- Bookmark Message
- Subscribe to Message
- Mute Message
- Subscribe to RSS Feed
- Permalink
- Report Inappropriate Content


The search on metrics.log has to be more precise.
When using metrics, always specify the "group", or apples and oranges may be counted together.
Please try :
index=_internal source=metrics.log group=syslog_connections | eval KBps=tcp_Bps/1024 | timechart avg(KBps) as KBps by destIp span=1h | eval MB=KBps_span/1000 | fields - KBps
- Mark as New
- Bookmark Message
- Subscribe to Message
- Mute Message
- Subscribe to RSS Feed
- Permalink
- Report Inappropriate Content
The search on metrics.log has to be more precise.
When using metrics, always specify the "group", or apples and oranges may be counted together.
Please try :
index=_internal source=metrics.log group=syslog_connections | eval KBps=tcp_Bps/1024 | timechart avg(KBps) as KBps by destIp span=1h | eval MB=KBps_span/1000 | fields - KBps

Join the Splunk Community Slack to learn, troubleshoot, and make connections with fellow Splunk practitioners in real time!
Join Splunk User Groups to connect and learn in-person by region or remotely by topic or industry.
Tuning Edge Processor in Hybrid Mode: What Limits Each Data Path
Best Practices: Splunk auto adjust pipeline queue
Request for Professional Development: Attending .conf26
