
Join the Conversation
- Find Answers
- :
- Splunk Administration
- :
- Getting Data In
- :
- Re: Windows Path monitor
- Subscribe to RSS Feed
- Mark Topic as New
- Mark Topic as Read
- Float this Topic for Current User
- Bookmark Topic
- Subscribe to Topic
- Mute Topic
- Printer Friendly Page
- Mark as New
- Bookmark Message
- Subscribe to Message
- Mute Message
- Subscribe to RSS Feed
- Permalink
- Report Inappropriate Content

When installing the "universal forwarder" I put a "path to monitor".
But I would like to add another path. How do I add more "path to monitor"?
- Mark as New
- Bookmark Message
- Subscribe to Message
- Mute Message
- Subscribe to RSS Feed
- Permalink
- Report Inappropriate Content
Thanks for the answer, researching I discovered more details that I think are important.
PATH: C:\Program Files\SplunkUniversalForwarder\etc\apps\SplunkUniversalForwarder\local
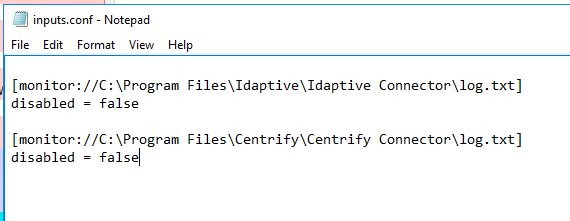
[monitor://C:\Program Files\Idaptive\Idaptive Connector\log.txt]
disabled = false
[monitor://C:\Program Files\Centrify\Centrify Connector\log.txt]
disabled = false
- Mark as New
- Bookmark Message
- Subscribe to Message
- Mute Message
- Subscribe to RSS Feed
- Permalink
- Report Inappropriate Content


Edit inputs.conf on the UF. Copy the existing monitor stanza and modify the copy to suit. Then restart the forwarder.
If this reply helps you, Karma would be appreciated.
- Mark as New
- Bookmark Message
- Subscribe to Message
- Mute Message
- Subscribe to RSS Feed
- Permalink
- Report Inappropriate Content
Thanks for the answer, researching I discovered more details that I think are important.
PATH: C:\Program Files\SplunkUniversalForwarder\etc\apps\SplunkUniversalForwarder\local
[monitor://C:\Program Files\Idaptive\Idaptive Connector\log.txt]
disabled = false
[monitor://C:\Program Files\Centrify\Centrify Connector\log.txt]
disabled = false
- Mark as New
- Bookmark Message
- Subscribe to Message
- Mute Message
- Subscribe to RSS Feed
- Permalink
- Report Inappropriate Content
If this reply helps you, Karma would be appreciated.
- Mark as New
- Bookmark Message
- Subscribe to Message
- Mute Message
- Subscribe to RSS Feed
- Permalink
- Report Inappropriate Content
No problem, I'm just sharing information that I think can help other people. Thank you.

Join the Splunk Community Slack to learn, troubleshoot, and make connections with fellow Splunk practitioners in real time!
Join Splunk User Groups to connect and learn in-person by region or remotely by topic or industry.
Make Your Machine Data AI-Ready in Splunk
Splunk Asynchronous Forwarding Explained
How to Monitor AI Agents with Splunk Agent Observability
