
Join the Conversation
- Find Answers
- :
- Splunk Administration
- :
- Getting Data In
- :
- Re: Splunk unexpected timestamp parsing behavior
- Subscribe to RSS Feed
- Mark Topic as New
- Mark Topic as Read
- Float this Topic for Current User
- Bookmark Topic
- Subscribe to Topic
- Mute Topic
- Printer Friendly Page
- Mark as New
- Bookmark Message
- Subscribe to Message
- Mute Message
- Subscribe to RSS Feed
- Permalink
- Report Inappropriate Content

Greetings,
In my environment, I have set up an Universal Forwarder that is monitoring a single server .log file, which is then forwarded to a Splunk indexer instance for parsing etc. as a specific sourcetype(log4j). My Universal Forwarder configuration is as follows:
inputs.conf
[default]
host = 1
[monitor://server.log]
sourcetype=log4j
index= targetIndex
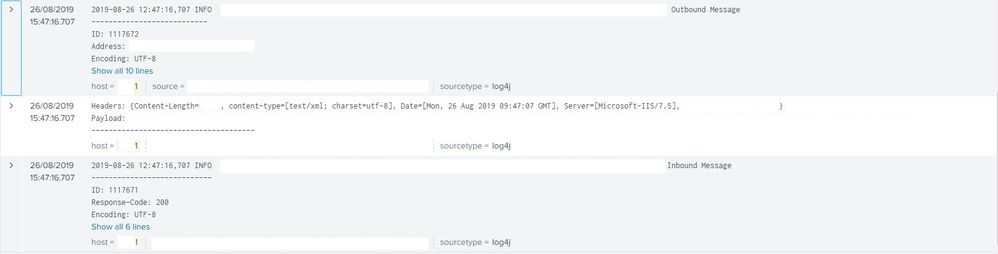
On the indexer, I have noticed several issues, both with timestamp parsing and event breaking. As you can see in the following image, there are events mixed in with local timestamps dating 3 hours ago, but Splunk has assigned the current time for said event. On top of that, Splunk has made a separate event for the Headers: and Payload: entries, which should have been a part of the event below. Note that these events all come from the same host and all have the same sourcetype.
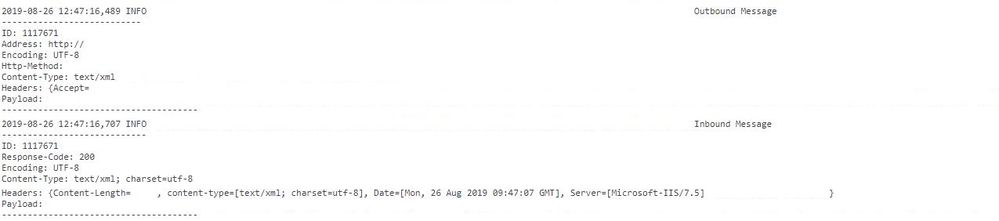
For additional context, the following image visualizes the format of the .log file as seen on the forwarding instance. Note how there is a slight gap between the second event's Content-Type and Headers fields, which, I believe, is what is causing Splunk to assign it to a separate event.
Here is the props.conf that I currently have set on my indexer instance:
[log4j]
BREAK_ONLY_BEFORE=\d\d\d\d-\d\d-\d\d\s\d\d:\d\d:\d\d.\d\d\d
MAX_TIMESTAMP_LOOKAHEAD=23
TZ=Europe/Riga
TIME_FORMAT=%Y-%m-%d %H:%M:%S.%3NZ
TIME_PREFIX=^
SHOULD_LINEMERGE=true
As well as the limits.conf, although, to my understanding, it shouldn't affect the parsing behavior:
limits.conf
[search]
max_rawsize_perchunk = 0
To summarize:
- Splunk is unexpectedly breaking up events;
- There are events dated back exactly 3 hours mixed in with current events;
Could this be a timezone issue? Both of the instances seem to have the same timezone (EEST), but there seem to be events dated back exactly 3 hours mixed in with current events. What could be the possible cause of this?
Thanks in advance!
- Mark as New
- Bookmark Message
- Subscribe to Message
- Mute Message
- Subscribe to RSS Feed
- Permalink
- Report Inappropriate Content


It looks to me like the TIME_FORMAT setting does not exactly match the sample data. Try TIME_FORMAT = %Y-%m-%d %H:%M:%S,%3N.
If this reply helps you, Karma would be appreciated.
- Mark as New
- Bookmark Message
- Subscribe to Message
- Mute Message
- Subscribe to RSS Feed
- Permalink
- Report Inappropriate Content
It looks to me like the TIME_FORMAT setting does not exactly match the sample data. Try TIME_FORMAT = %Y-%m-%d %H:%M:%S,%3N.
If this reply helps you, Karma would be appreciated.
- Mark as New
- Bookmark Message
- Subscribe to Message
- Mute Message
- Subscribe to RSS Feed
- Permalink
- Report Inappropriate Content
Thank you very much, that did it!




Join the Splunk Community Slack to learn, troubleshoot, and make connections with fellow Splunk practitioners in real time!
Join Splunk User Groups to connect and learn in-person by region or remotely by topic or industry.
How much can you really learn in 3 minutes?
Event Series: The Agentic SOC: Trust Before Autonomy
Free Professional Services for .conf26 Attendees
