Turn on suggestions
Auto-suggest helps you quickly narrow down your search results by suggesting possible matches as you type.
Getting Data In
×
Join the Conversation
Without signing in, you're just watching from the sidelines. Sign in or Register to connect, share, and be part of the Splunk Community.
Turn on suggestions
Auto-suggest helps you quickly narrow down your search results by suggesting possible matches as you type.
- Find Answers
- :
- Splunk Administration
- :
- Getting Data In
- :
- Multiline Event with Values
Options
- Subscribe to RSS Feed
- Mark Topic as New
- Mark Topic as Read
- Float this Topic for Current User
- Bookmark Topic
- Subscribe to Topic
- Mute Topic
- Printer Friendly Page
- Mark as New
- Bookmark Message
- Subscribe to Message
- Mute Message
- Subscribe to RSS Feed
- Permalink
- Report Inappropriate Content
trever
Loves-to-Learn
05-04-2020
11:47 PM
I have an event that is multiple lines:
Mon May  4 22:06:47 PDT 2020
/dev/sdb1       13245631 12450471    127548  99% /Volumes/Media
/dev/sdd2        9460988  7196839   1787272  81% /Volumes/Media 2
I'm trying to turn it into something that I can monitor over time in a time chart but I'm having trouble getting this split up properly. I tried this:
index=sysmon | rex max_match=0 (?<event>.*)\N | rex max_match=0 \/dev\/(?<drive>\w+)\s*(?<blocks>\d+)\s*(?<used>\d+)\s*(?<available>\d+)\s*(?<usepcnt>\d+)%\s*(?<mounted>.*) | timechart span=30m values(used) by drive
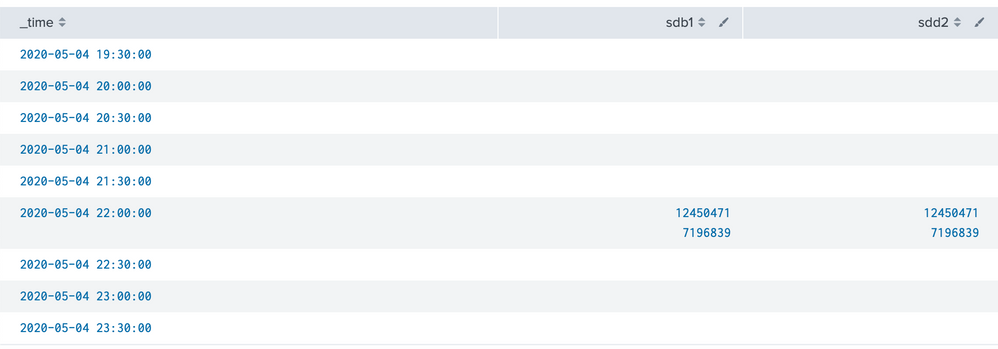
It starts to look right in the table, I have time and values but they are all grouped together still:
1 Solution
- Mark as New
- Bookmark Message
- Subscribe to Message
- Mute Message
- Subscribe to RSS Feed
- Permalink
- Report Inappropriate Content
richgalloway

SplunkTrust
05-05-2020
06:27 AM
The max_match option of rex produces multi-value fields. You must use mvexpand to create separate events for each value. Perhaps this run-anywhere query will help.
| makeresults
| eval raw="Mon May  4 22:06:47 PDT 2020
 /dev/sdb1       13245631 12450471    127548  99% /Volumes/Media
 /dev/sdd2        9460988  7196839   1787272  81% /Volumes/Media 2"
| rex field=raw max_match=0 (?<event>.*)\N
| mvexpand event
| rex field=event max_match=0 \/dev\/(?<drive>\w+)\s*(?<blocks>\d+)\s*(?<used>\d+)\s*(?<available>\d+)\s*(?<usepcnt>\d+)%\s*(?<mounted>.*)
| timechart span=30m values(used) by drive
---
If this reply helps you, Karma would be appreciated.
If this reply helps you, Karma would be appreciated.
- Mark as New
- Bookmark Message
- Subscribe to Message
- Mute Message
- Subscribe to RSS Feed
- Permalink
- Report Inappropriate Content
richgalloway

SplunkTrust
05-05-2020
06:27 AM
The max_match option of rex produces multi-value fields. You must use mvexpand to create separate events for each value. Perhaps this run-anywhere query will help.
| makeresults
| eval raw="Mon May  4 22:06:47 PDT 2020
 /dev/sdb1       13245631 12450471    127548  99% /Volumes/Media
 /dev/sdd2        9460988  7196839   1787272  81% /Volumes/Media 2"
| rex field=raw max_match=0 (?<event>.*)\N
| mvexpand event
| rex field=event max_match=0 \/dev\/(?<drive>\w+)\s*(?<blocks>\d+)\s*(?<used>\d+)\s*(?<available>\d+)\s*(?<usepcnt>\d+)%\s*(?<mounted>.*)
| timechart span=30m values(used) by drive
---
If this reply helps you, Karma would be appreciated.
If this reply helps you, Karma would be appreciated.
- Mark as New
- Bookmark Message
- Subscribe to Message
- Mute Message
- Subscribe to RSS Feed
- Permalink
- Report Inappropriate Content
trever
Loves-to-Learn
05-05-2020
03:54 PM
That did exactly what I was looking for! Thank you!
Get Updates on the Splunk Community!
Unlock Database Monitoring with Splunk Observability Cloud
In today’s fast-paced digital landscape, even minor database slowdowns can disrupt user experiences and ...
Purpose in Action: How Splunk Is Helping Power an Inclusive Future for All
At Cisco, purpose isn’t a tagline—it’s a commitment. Cisco’s FY25 Purpose Report outlines how the company is ...
[Upcoming Webinar] Demo Day: Transforming IT Operations with Splunk
Join us for a live Demo Day at the Cisco Store on January 21st 10:00am - 11:00am PST
In the fast-paced world ...

