Turn on suggestions
Auto-suggest helps you quickly narrow down your search results by suggesting possible matches as you type.
Getting Data In
×
Join the Conversation
Without signing in, you're just watching from the sidelines. Sign in or Register to connect, share, and be part of the Splunk Community.
Turn on suggestions
Auto-suggest helps you quickly narrow down your search results by suggesting possible matches as you type.
- Find Answers
- :
- Splunk Administration
- :
- Getting Data In
- :
- Re: Multiline Event with Values
Options
- Subscribe to RSS Feed
- Mark Topic as New
- Mark Topic as Read
- Float this Topic for Current User
- Bookmark Topic
- Subscribe to Topic
- Mute Topic
- Printer Friendly Page
- Mark as New
- Bookmark Message
- Subscribe to Message
- Mute Message
- Subscribe to RSS Feed
- Permalink
- Report Inappropriate Content
trever
Loves-to-Learn
05-04-2020
11:47 PM
I have an event that is multiple lines:
Mon May  4 22:06:47 PDT 2020
/dev/sdb1       13245631 12450471    127548  99% /Volumes/Media
/dev/sdd2        9460988  7196839   1787272  81% /Volumes/Media 2
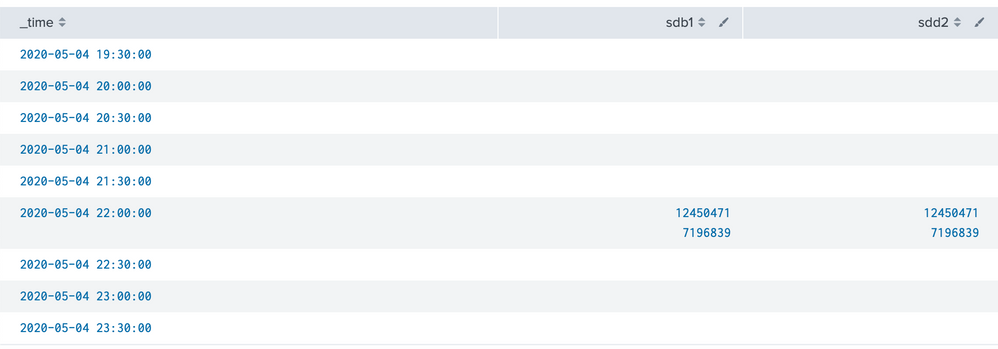
I'm trying to turn it into something that I can monitor over time in a time chart but I'm having trouble getting this split up properly. I tried this:
index=sysmon | rex max_match=0 (?<event>.*)\N | rex max_match=0 \/dev\/(?<drive>\w+)\s*(?<blocks>\d+)\s*(?<used>\d+)\s*(?<available>\d+)\s*(?<usepcnt>\d+)%\s*(?<mounted>.*) | timechart span=30m values(used) by drive
It starts to look right in the table, I have time and values but they are all grouped together still:
1 Solution
- Mark as New
- Bookmark Message
- Subscribe to Message
- Mute Message
- Subscribe to RSS Feed
- Permalink
- Report Inappropriate Content
richgalloway

SplunkTrust
05-05-2020
06:27 AM
The max_match option of rex produces multi-value fields. You must use mvexpand to create separate events for each value. Perhaps this run-anywhere query will help.
| makeresults
| eval raw="Mon May  4 22:06:47 PDT 2020
 /dev/sdb1       13245631 12450471    127548  99% /Volumes/Media
 /dev/sdd2        9460988  7196839   1787272  81% /Volumes/Media 2"
| rex field=raw max_match=0 (?<event>.*)\N
| mvexpand event
| rex field=event max_match=0 \/dev\/(?<drive>\w+)\s*(?<blocks>\d+)\s*(?<used>\d+)\s*(?<available>\d+)\s*(?<usepcnt>\d+)%\s*(?<mounted>.*)
| timechart span=30m values(used) by drive
---
If this reply helps you, Karma would be appreciated.
If this reply helps you, Karma would be appreciated.
- Mark as New
- Bookmark Message
- Subscribe to Message
- Mute Message
- Subscribe to RSS Feed
- Permalink
- Report Inappropriate Content
richgalloway

SplunkTrust
05-05-2020
06:27 AM
The max_match option of rex produces multi-value fields. You must use mvexpand to create separate events for each value. Perhaps this run-anywhere query will help.
| makeresults
| eval raw="Mon May  4 22:06:47 PDT 2020
 /dev/sdb1       13245631 12450471    127548  99% /Volumes/Media
 /dev/sdd2        9460988  7196839   1787272  81% /Volumes/Media 2"
| rex field=raw max_match=0 (?<event>.*)\N
| mvexpand event
| rex field=event max_match=0 \/dev\/(?<drive>\w+)\s*(?<blocks>\d+)\s*(?<used>\d+)\s*(?<available>\d+)\s*(?<usepcnt>\d+)%\s*(?<mounted>.*)
| timechart span=30m values(used) by drive
---
If this reply helps you, Karma would be appreciated.
If this reply helps you, Karma would be appreciated.
- Mark as New
- Bookmark Message
- Subscribe to Message
- Mute Message
- Subscribe to RSS Feed
- Permalink
- Report Inappropriate Content
trever
Loves-to-Learn
05-05-2020
03:54 PM
That did exactly what I was looking for! Thank you!
Get Updates on the Splunk Community!
App Platform's 2025 Year in Review: A Year of Innovation, Growth, and Community
As we step into 2026, it’s the perfect moment to reflect on what an extraordinary year 2025 was for the Splunk ...
Operationalizing Entity Risk Score with Enterprise Security 8.3+
Overview
Enterprise Security 8.3 introduces a powerful new feature called “Entity Risk Scoring” (ERS) for ...
Unlock Database Monitoring with Splunk Observability Cloud
In today’s fast-paced digital landscape, even minor database slowdowns can disrupt user experiences and ...

