
Join the Conversation
- Find Answers
- :
- Splunk Administration
- :
- Getting Data In
- :
- Re: Mark values in Diagram
- Subscribe to RSS Feed
- Mark Topic as New
- Mark Topic as Read
- Float this Topic for Current User
- Bookmark Topic
- Subscribe to Topic
- Mute Topic
- Printer Friendly Page
- Mark as New
- Bookmark Message
- Subscribe to Message
- Mute Message
- Subscribe to RSS Feed
- Permalink
- Report Inappropriate Content

Hi,
so I have a Bargraph with many values. The enduser who has to use that bargraph needs to see if the values are over or under certain values at some point. Thats why I want to draw a line at both the max allowed value and the min needed value. I attached a picture of how I want it to look. Is it possible to achieve something like this?
- Mark as New
- Bookmark Message
- Subscribe to Message
- Mute Message
- Subscribe to RSS Feed
- Permalink
- Report Inappropriate Content


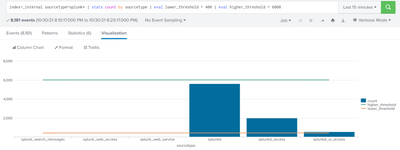
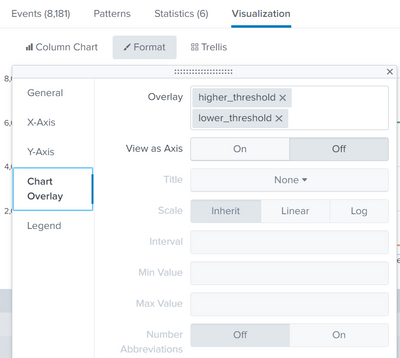
I believe you are trying to add threshold values to your Column chart. If so please try in adding the threshold limits via eval . And add them as chart overlays as shown below
index=_internal sourcetype=splunk* | stats count by sourcetype | eval lower_threshold = 400 | eval higher_threshold = 6000
- Mark as New
- Bookmark Message
- Subscribe to Message
- Mute Message
- Subscribe to RSS Feed
- Permalink
- Report Inappropriate Content
I believe you are trying to add threshold values to your Column chart. If so please try in adding the threshold limits via eval . And add them as chart overlays as shown below
index=_internal sourcetype=splunk* | stats count by sourcetype | eval lower_threshold = 400 | eval higher_threshold = 6000
- Mark as New
- Bookmark Message
- Subscribe to Message
- Mute Message
- Subscribe to RSS Feed
- Permalink
- Report Inappropriate Content
Hi again,
I now managed to show these thresholds in my chart. There is one Problem: I need the threshold on the X Axis not on the Y Axis(as I showed in the picture in my initial post above). Is there a way to do that?
- Mark as New
- Bookmark Message
- Subscribe to Message
- Mute Message
- Subscribe to RSS Feed
- Permalink
- Report Inappropriate Content
Thanks for the reply,
this seems to be exactly what I need, but I am not able to achieve the same result as you with my chart. I want to show just the value of one particular field and how often the different values exist. I do this via the pivot Tool. I cant find the Overlay option. DoI have to use the eval command?



Join the Splunk Community Slack to learn, troubleshoot, and make connections with fellow Splunk practitioners in real time!
Join Splunk User Groups to connect and learn in-person by region or remotely by topic or industry.
Analytics Workspace removal in Splunk 10.6
Vibe-coding, AI, and Splunkcraft: Highlights from the .conf26 Builder Bar
Thanks for the Memories: .conf26 Took Learning to New Heights
