- Find Answers
- :
- Splunk Administration
- :
- Getting Data In
- :
- Re: JSON is being cut off at "created" key
- Subscribe to RSS Feed
- Mark Topic as New
- Mark Topic as Read
- Float this Topic for Current User
- Bookmark Topic
- Subscribe to Topic
- Mute Topic
- Printer Friendly Page
- Mark as New
- Bookmark Message
- Subscribe to Message
- Mute Message
- Subscribe to RSS Feed
- Permalink
- Report Inappropriate Content
I've got a pretty strange issue, and I'm sure there is a simple answer for it. Here is my env:
- 7.1.2
- All default configs, but the inputs.conf which contains
[monitor:///Users/MYUSER/splunk_messages]
index = test
sourcetype = json
When I update the splunk_messages file with the following JSON, it's cutting it off right before "created":
{
"Data": {
"id": "-LGDT2S8qYVIJvqoLJwC",
"created": "2018-06-30T02:14:18Z",
"expires": "2018-07-01T02:14:18Z",
"status": "WAITING",
"completed": 0,
"reason": "NONE"
}
}
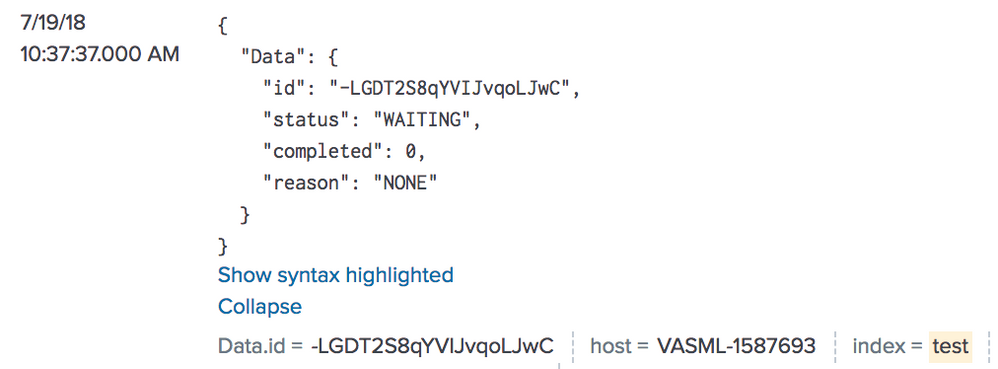
The result is
There are no other events after or before this event. It's not like it's splitting the event.
I then remove "created" key and value and the full JSON event shows:
Does anyone know what could be causing this? I've been looking through the default conf files and can't find anything to cause this. Maybe it's a default behavior of splunk and I'm not seeing it in the docs.
Thanks!
- Mark as New
- Bookmark Message
- Subscribe to Message
- Mute Message
- Subscribe to RSS Feed
- Permalink
- Report Inappropriate Content
Finally figured this out.
The entire log wasn't just JSON. It was a mix of text and JSON ON DIFFERENT LINES:
2018-07-25 00:00:04,169 DEBUG [1532476571629] [49] Coral job status response: {
  "Data": {
    "id": "-LIDiA9URgCSYRGHoIPj",
    "created": "2018-07-24T23:56:08Z",
    "expires": "2018-07-25T23:56:08Z",
    "status": "PROCESSING",
    "completed": 1,
    "reason": "NONE"
  }
}
The suggestions by YoungDaniel was helpful, but it was only working if it was pure JSON all on one line.
I had a suspicion that MAX_TIMESTAMP_LOOKAHEAD was the real culprit here. Setting MAX_TIMESTAMP_LOOKAHEAD = 1 seems to be working!
- Mark as New
- Bookmark Message
- Subscribe to Message
- Mute Message
- Subscribe to RSS Feed
- Permalink
- Report Inappropriate Content
Hello @helius,
Just guessing here, but it probably comes from the fact that the timestamp recognition of the event changes if you remove the line containing created, according to your screenshots.
In case your set of json events share the 'created' key, please try to set the TIME_PREFIX of the sourcetype.
I hope this helps
- Mark as New
- Bookmark Message
- Subscribe to Message
- Mute Message
- Subscribe to RSS Feed
- Permalink
- Report Inappropriate Content
Tried that and also MAX_TIMESTAMP_LOOKAHEAD = 0. No difference after a restart.
- Mark as New
- Bookmark Message
- Subscribe to Message
- Mute Message
- Subscribe to RSS Feed
- Permalink
- Report Inappropriate Content
Hi, to make sure it is not a timestamp parsing issue, you can add the
DATETIME_CONFIG = CURRENT
to the props.conf. That will set the timestamp to the indexed time. If the events are still breaking I would look at the sourcetype configuration. You can also try to set the TIME_PREFIX = "created :" to set the timestamp field.
It might be a good idea to add the
INDEXED_EXTRACTIONS = json
to the props.conf make sure the Json is parsed correctly.
If all fails. I usually take a sample of the json logs and use the data import in the gui to make sure that the data is being parsed correctly. It will give you instant feedback and you have the possibility to set the props specs.


