Join the Conversation
- Find Answers
- :
- Splunk Administration
- :
- Getting Data In
- :
- How to parse radius/NPS log files in Splunk?
- Subscribe to RSS Feed
- Mark Topic as New
- Mark Topic as Read
- Float this Topic for Current User
- Bookmark Topic
- Subscribe to Topic
- Mute Topic
- Printer Friendly Page
- Mark as New
- Bookmark Message
- Subscribe to Message
- Mute Message
- Subscribe to RSS Feed
- Permalink
- Report Inappropriate Content
Hello,
I've tried parsing my Radius log files using this tutorial : https://fraserclark926577729.wordpress.com/2019/12/18/monitoring-windows-nps-logs-with-splunk/
So i created my app in "/opt/splunk/etc/deployment-apps/nps_monitor" and in "/opt/splunk/etc/deployment-apps/nps_monitor/local" my 3 files :
app.conf:
#
# Splunk app configuration file
#
[install]
is_configured = 0
[ui]
is_visible = 1
label = nps_monitor
[launcher]
author = NW
description =
version = 1.0.0
props.conf:
[ias]
 SHOULD_LINEMERGE = false
 KV_MODE = NONE
 INDEXED_EXTRACTIONS = CSV # The type of file that Splunk software should expect for a given sourcetype, and the extraction and/or parsing method that should be used on the file.
 # This setting tells Splunk to specify the header field names directly
 FIELD_NAMES = ComputerName,ServiceName,Record_Date,Record_Time,Packet_Type,User_Name,Fully_Qualified_Distinguished_Name,
Called_Station_ID,Calling_Station_ID,Callback_Number,Framed_IP_Address,NAS_Identifier,NAS_IP_Address,NAS_Port,Client_Vendor,Client_IP_Address,
Client_Friendly_Name,Event_Timestamp,Port_Limit,NAS_Port_Type,Connect_Info,Framed_Protocol,Service_Type,Authentication_Type,Policy_Name,Reason_Code,
Class,Session_Timeout,Idle_Timeout,Termination_Action,EAP_Friendly_Name,Acct_Status_Type,Acct_Delay_Time,Acct_Input_Octets,Acct_Output_Octets,Acct_Session_Id,
Acct_Authentic,Acct_Session_Time,Acct_Input_Packets,Acct_Output_Packets,Acct_Terminate_Cause,Acct_Multi_Ssn_ID,Acct_Link_Count,Acct_Interim_Interval,
Tunnel_Type,Tunnel_Medium_Type,Tunnel_Client_Endpt,Tunnel_Server_Endpt,Acct_Tunnel_Conn,Tunnel_Pvt_Group_ID,Tunnel_Assignment_ID,Tunnel_Preference,
MS_Acct_Auth_Type,MS_Acct_EAP_Type,MS_RAS_Version,MS_RAS_Vendor,MS_CHAP_Error,MS_CHAP_Domain,MS_MPPE_Encryption_Types,MS_MPPE_Encryption_Policy,
Proxy_Policy_Name,Provider_Type,Provider_Name,Remote_Server_Address,MS_RAS_Client_Name,MS_RAS_Client_Version
 TIME_FORMAT = %m/%d/%Y%n%H:%M:%S
 MAX_TIMESTAMP_LOOKAHEAD = 20
 TIMESTAMP_FIELDS = Record_Date,Record_Time
 DATETIME_CONFIG =
 NO_BINARY_CHECK = true
 disabled = false
 pulldown_type = true
inputs.conf:
[monitor://C:\NPS-Log\IN*.log]
sourcetype = ias
index = radius
disabled = 0
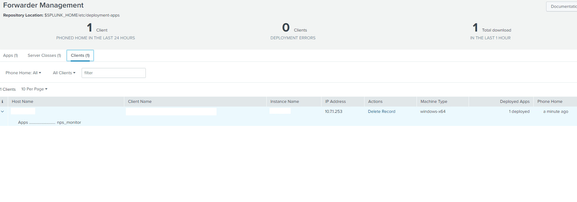
i've deployed my app on my server :
I can see the app on my server folder too but no data are coming into my "radius" index.
Did I miss something ? Thanks for your help
- Mark as New
- Bookmark Message
- Subscribe to Message
- Mute Message
- Subscribe to RSS Feed
- Permalink
- Report Inappropriate Content
The first error message quoted referred to previous error messages. Did you look at them? What did they say?
I suspect these messages stem from the invalid INDEXED_EXTRACTIONS value in props.conf. Comments must be on separate lines. A comment on the same line as a setting is considered part of the setting's value.
If this reply helps you, Karma would be appreciated.
- Mark as New
- Bookmark Message
- Subscribe to Message
- Mute Message
- Subscribe to RSS Feed
- Permalink
- Report Inappropriate Content
Verify the contents of the props.conf and inputs.conf files are correct. Is the file path specified in the input the right one for your environment? Does Splunk have read access to the file? Have you checked splunkd.log on the forwarder? Are the forwarder's internal logs being sent to your indexers? If not, then fix that first.
If this reply helps you, Karma would be appreciated.
- Mark as New
- Bookmark Message
- Subscribe to Message
- Mute Message
- Subscribe to RSS Feed
- Permalink
- Report Inappropriate Content
Here is the error I'm getting in splunkd.log :
05-26-2023 16:04:36.873 +0200 ERROR TailReader [10796 tailreader0] - Ignoring path="C:\NPS-Log\IN230331.log" due to: Invalid indexed extractions configuration - see prior error messages
05-26-2023 16:04:36.874 +0200 ERROR IndexedExtractionsConfig [10796 tailreader0] - Invalid value='CSV # The type of file that Splunk software should expect for a given sourcetype, and the extraction and/or parsing
I copied the props.conf from https://community.splunk.com/t5/All-Apps-and-Add-ons/How-to-parse-Radius-log-files-into-splunk-What-... maybe it's wrongn what should I replace in my indexed_extractions ?
- Mark as New
- Bookmark Message
- Subscribe to Message
- Mute Message
- Subscribe to RSS Feed
- Permalink
- Report Inappropriate Content
The first error message quoted referred to previous error messages. Did you look at them? What did they say?
I suspect these messages stem from the invalid INDEXED_EXTRACTIONS value in props.conf. Comments must be on separate lines. A comment on the same line as a setting is considered part of the setting's value.
If this reply helps you, Karma would be appreciated.

