Are you a member of the Splunk Community?
- Find Answers
- :
- Using Splunk
- :
- Dashboards & Visualizations
- :
- Re: timechart results
- Subscribe to RSS Feed
- Mark Topic as New
- Mark Topic as Read
- Float this Topic for Current User
- Bookmark Topic
- Subscribe to Topic
- Mute Topic
- Printer Friendly Page
- Mark as New
- Bookmark Message
- Subscribe to Message
- Mute Message
- Subscribe to RSS Feed
- Permalink
- Report Inappropriate Content
timechart results
Hi,
I'm new to Splunk, but already loving it.
I have connected Splunk with our Jamf Pro instance and I'm trying to track the macOS upgrade process based on the macOS Build version.
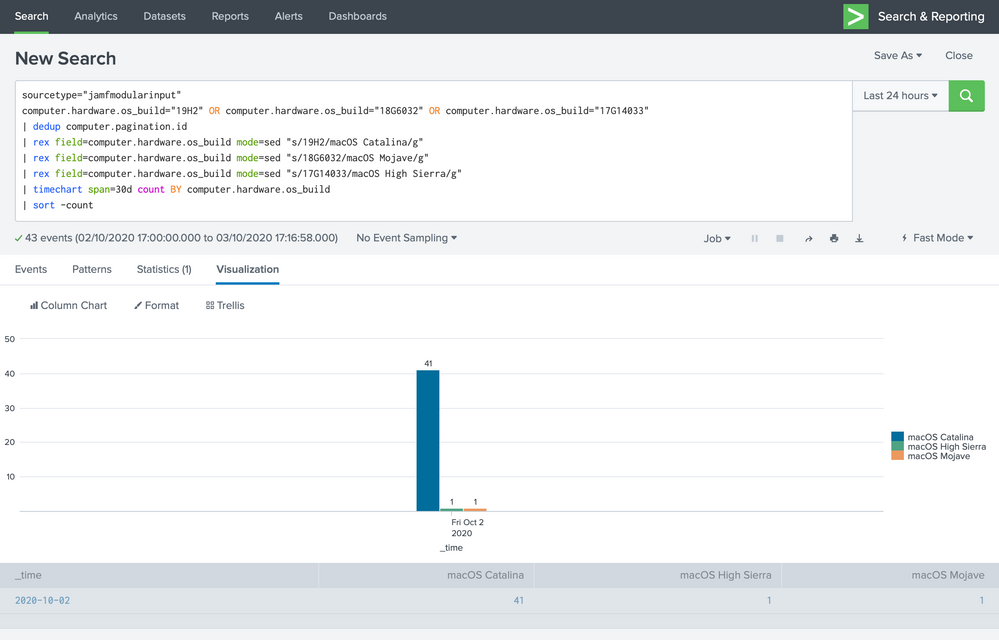
Unfortunately, I'm only getting the results on the last, current day and not the last 30 days.
sourcetype="jamfmodularinput"
computer.hardware.os_build="19H2" OR computer.hardware.os_build="18G6032" OR computer.hardware.os_build="17G14033"
| dedup computer.pagination.id
| rex field=computer.hardware.os_build mode=sed "s/19H2/macOS Catalina/g"
| rex field=computer.hardware.os_build mode=sed "s/18G6032/macOS Mojave/g"
| rex field=computer.hardware.os_build mode=sed "s/17G14033/macOS High Sierra/g"
| timechart span=30d count BY computer.hardware.os_build
| sort -count
Could you please let me know what I'm doing wrong?
Thank you in advance,
D
- Mark as New
- Bookmark Message
- Subscribe to Message
- Mute Message
- Subscribe to RSS Feed
- Permalink
- Report Inappropriate Content
Hi @DimitriosP,
you're using 24 hours as time picker, so you're using only the events in the last 24 hours, so it's correct the result you have.
If you want a time distribution of 30 days, you have to use a larger time picker, or insert time modifiers (that override time picker) in your search.
Then you used span=30 days in timechart, this means that you have all the results in one column.
One hint, you don't need to replace values in field using rex command, you can also use eval instead the three rexes:
| eval computer.hardware.os_build=case(computer.hardware.os_build="19H2","macOS Catalina",computer.hardware.os_build="18G6032","macOS Mojave",computer.hardware.os_build="17G14033","macOS High Sierra")So you could have:
sourcetype="jamfmodularinput"
computer.hardware.os_build="19H2" OR computer.hardware.os_build="18G6032" OR computer.hardware.os_build="17G14033" earliest=-30d@d latest=now
| dedup computer.pagination.id
| eval computer.hardware.os_build=case(computer.hardware.os_build="19H2","macOS Catalina",computer.hardware.os_build="18G6032","macOS Mojave",computer.hardware.os_build="17G14033","macOS High Sierra")
| timechart span=1d count BY computer.hardware.os_build
Ciao.
Giuseppe
- Mark as New
- Bookmark Message
- Subscribe to Message
- Mute Message
- Subscribe to RSS Feed
- Permalink
- Report Inappropriate Content
Hi gcusello
Thank you for your reply
In the beginning, I was playing around with eval instead of rex field but never managed to make it work
Puts all the results under the same column
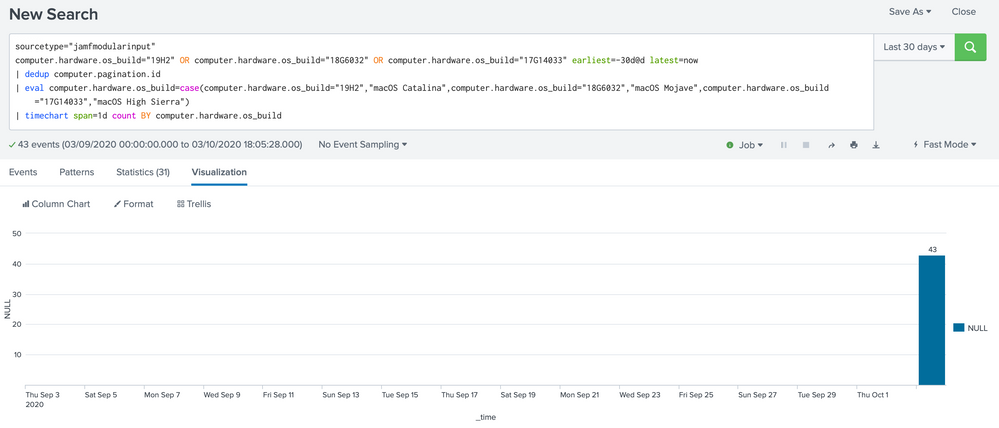
when I put your Search here is what I'm getting:
Thank you in advance
D
- Mark as New
- Bookmark Message
- Subscribe to Message
- Mute Message
- Subscribe to RSS Feed
- Permalink
- Report Inappropriate Content
Hi @DimitriosP,
I see two problems:
- al the events have the same timestamp;
- the computer.hardware.os_build isn'r recognized in all the events.
For the first problem, check timestamp of your events, because they seem to be all in the same day and see if you have events also in other days.
For the second one, it seems that the eval doesn't find none of the computer.hardware.os_build values you used in the eval command; could you share a sample of your logs?
At the end, I hint to add to your main search also the index/es to use.
Ciao.
Giuseppe
- Mark as New
- Bookmark Message
- Subscribe to Message
- Mute Message
- Subscribe to RSS Feed
- Permalink
- Report Inappropriate Content
Hi @gcusello ,
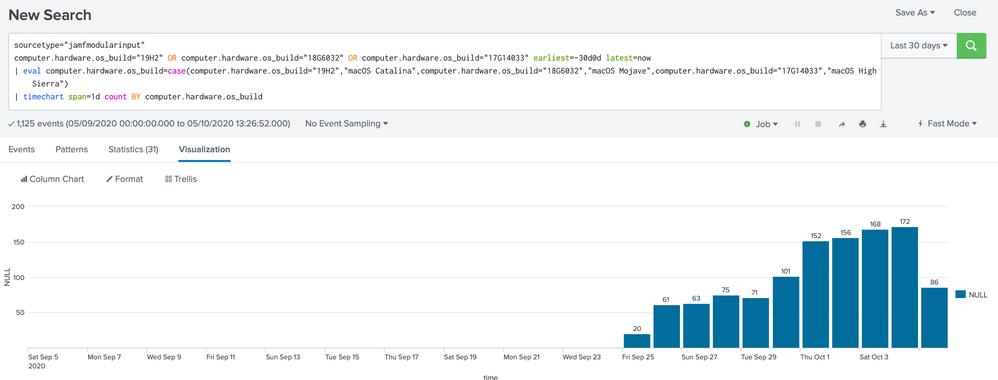
if I remove (| dedup computer.pagination.id) I get results all the way back to Sep 25 the day I set up my Splunk with Jamf
sourcetype="jamfmodularinput"
computer.hardware.os_build="19H2" OR computer.hardware.os_build="18G6032" OR computer.hardware.os_build="17G14033" earliest=-30d@d latest=now
| eval computer.hardware.os_build=case(computer.hardware.os_build="19H2","macOS Catalina",computer.hardware.os_build="18G6032","macOS Mojave",computer.hardware.os_build="17G14033","macOS High Sierra")
| timechart span=1d count BY computer.hardware.os_build
But when I use your search (| eval)I only get one value null, and I don't get separated columns for each macOS build. On the other hand, when I use (| rex) I get the macOS Build separately
thank you in advance
- Mark as New
- Bookmark Message
- Subscribe to Message
- Mute Message
- Subscribe to RSS Feed
- Permalink
- Report Inappropriate Content
Hi @DimitriosP,
Ok you solved problem 1
fpr problem 2, you should see the values in computer.hardware.os_build before timechart and eval.
Please make s mad test:
sourcetype="jamfmodularinput"
computer.hardware.os_build="19H2" OR computer.hardware.os_build="18G6032" OR computer.hardware.os_build="17G14033" earliest=-30d@d latest=now
| rename computer.hardware.os_build AS os_build
| eval os_build=case(os_build="19H2","macOS Catalina",os_build="18G6032","macOS Mojave",os_build="17G14033","macOS High Sierra")
| timechart span=1d count BY os_build
Ciao.
Giuseppe
- Mark as New
- Bookmark Message
- Subscribe to Message
- Mute Message
- Subscribe to RSS Feed
- Permalink
- Report Inappropriate Content
Hi @gcusello ,
Unfortunately, problem one is not resolved as in the time chard for today I get 125 computers when I should only get 43, I think there are duplicate resaults.
That's why I used (| dedup computer.pagination.id) to get only the actual computers
for example:
sourcetype="jamfmodularinput"
| dedup computer.general.id
| stats count(computer.general.id)
I get 861 computers
If I run:
sourcetype="jamfmodularinput"
| stats count(computer.general.id)
I get 3440 computers
unfortunately for some reason (| dedup computer.general.id) do not seem to work on timechart
Thank you in advance
- Mark as New
- Bookmark Message
- Subscribe to Message
- Mute Message
- Subscribe to RSS Feed
- Permalink
- Report Inappropriate Content
Hi @DimitriosP,
I always insert index definition in all my searches.
then manually see the values of computer.hardware.os_build.
Could you share your search?
Ciao.
Giuseppe
- Mark as New
- Bookmark Message
- Subscribe to Message
- Mute Message
- Subscribe to RSS Feed
- Permalink
- Report Inappropriate Content
Hi @gcusello ,
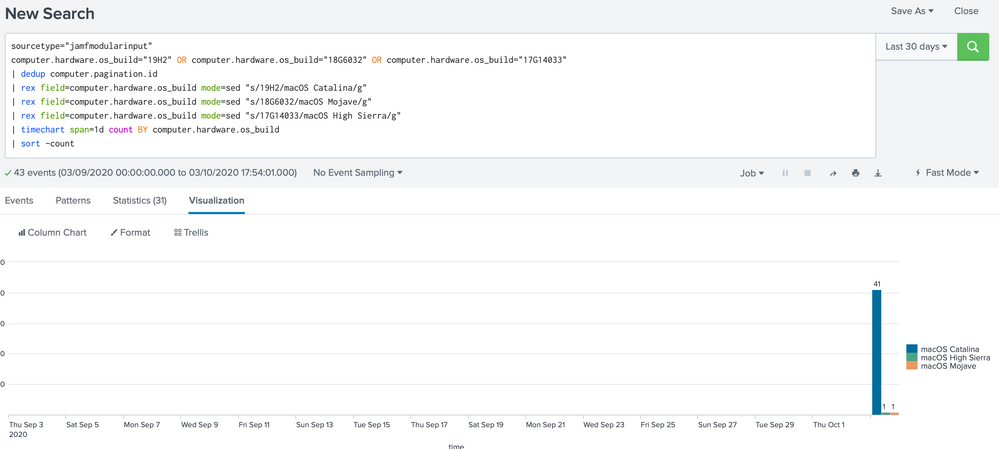
Here are the two searches, I have changed the time to 30 days.
The 861 is the correct one.
I'm not sure how to insert index
Thank you in advance
D
- Mark as New
- Bookmark Message
- Subscribe to Message
- Mute Message
- Subscribe to RSS Feed
- Permalink
- Report Inappropriate Content
Hi @DimitriosP,
with the 861, you always have 1 as result of the count.
Anyway, my hint is to add index in the main search, e.g. index=wineventlog, sourcetype =Security
Ciao.
Giuseppe
- Mark as New
- Bookmark Message
- Subscribe to Message
- Mute Message
- Subscribe to RSS Feed
- Permalink
- Report Inappropriate Content
Two things need to change.
1) The time picker is set to 24 hours, which means Splunk will only look at data from the last day. Change it to "Last 30 days".
2) The span option in the timechart command groups the events into "buckets". "Span=30d" says to make each bucket hold 30 days of data, which may not be what is desired. Try | timechart span=1d count by computer_hardware.os_build to see the number of upgrades on each day of the month.
If this reply helps you, Karma would be appreciated.
- Mark as New
- Bookmark Message
- Subscribe to Message
- Mute Message
- Subscribe to RSS Feed
- Permalink
- Report Inappropriate Content
Hi richgalloway,
Thank you for your quick response 🙂
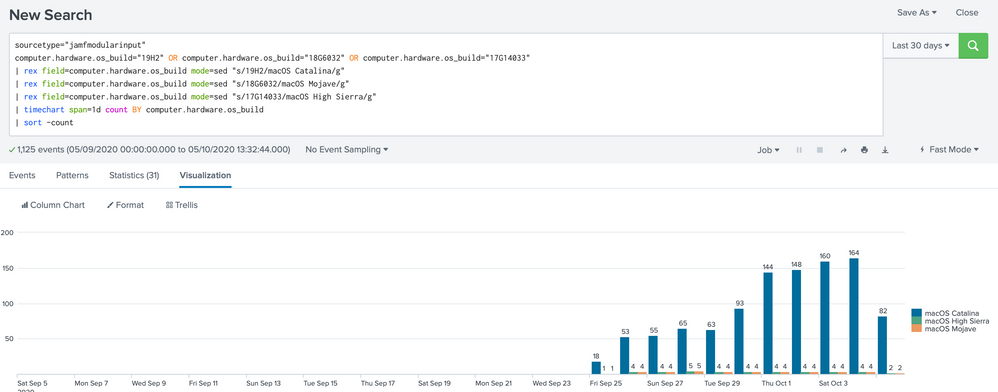
I followed your instructions, changed the time picker to 30 days and span=1 that worked
but still don't get any results for older days
I removed "| dedup computer.pagination.id" if I'm not mistaken search unique computers based on ID
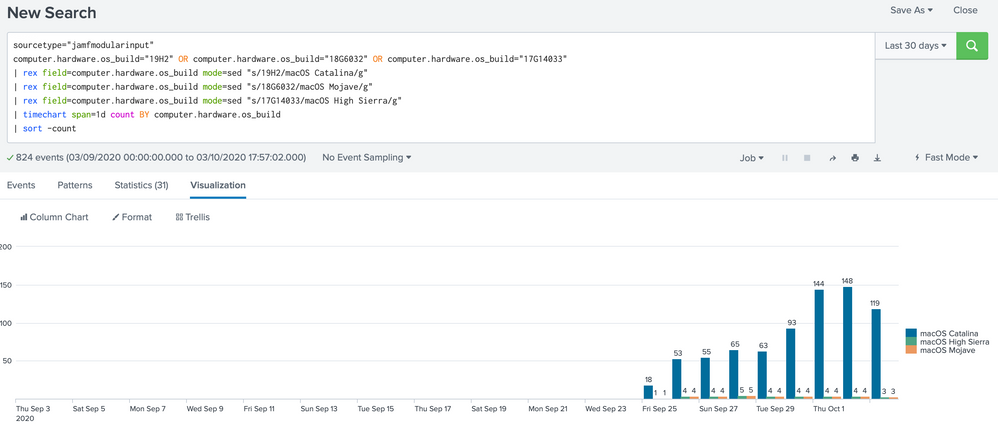
When removed I get results from older dates
This is what I should see
thank you in advance
D
