Join the Conversation
- Find Answers
- :
- Using Splunk
- :
- Dashboards & Visualizations
- :
- Re: Time/count mapping in visualization chart diff...
- Subscribe to RSS Feed
- Mark Topic as New
- Mark Topic as Read
- Float this Topic for Current User
- Bookmark Topic
- Subscribe to Topic
- Mute Topic
- Printer Friendly Page
- Mark as New
- Bookmark Message
- Subscribe to Message
- Mute Message
- Subscribe to RSS Feed
- Permalink
- Report Inappropriate Content
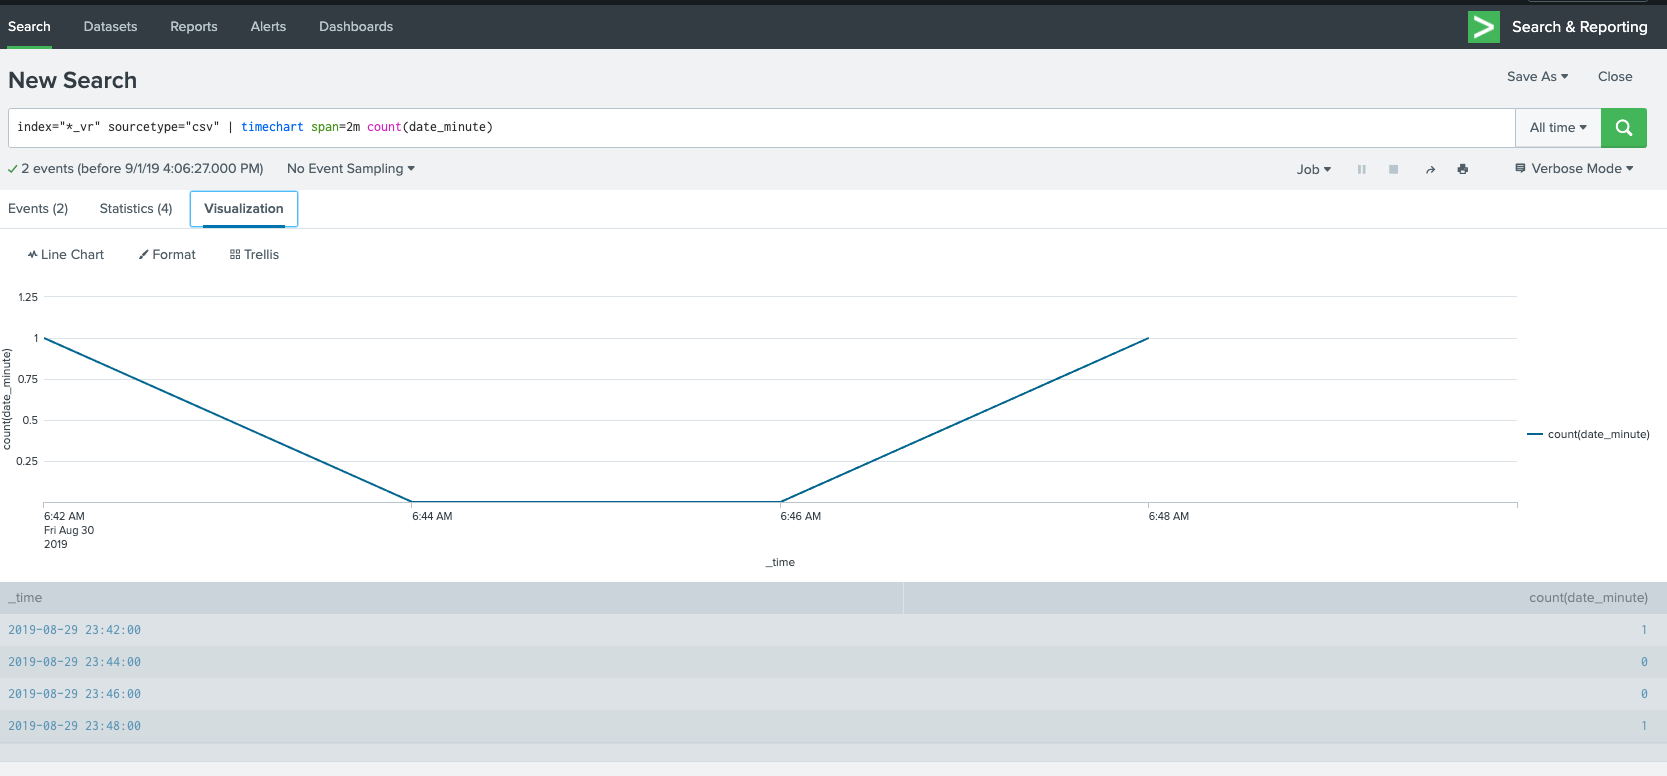
I indexed data from a csv file and then tried to plot data for count of events every 2 minutes. I get correct results in the statistics table, but when I see the chart in visualization, the count of events get reflected for time that is > 7 hrs from what is in the table below or statistics table. Any idea why data in statistics table not match with the visualization chart? Thanks.

- Mark as New
- Bookmark Message
- Subscribe to Message
- Mute Message
- Subscribe to RSS Feed
- Permalink
- Report Inappropriate Content
Hello @sajithpv,
This can happen in case you have a timezone settings related to your role.
I would bet the the events contain a given timezone and that your role is associated with a different one (+7 hours). Can you please check?
- Mark as New
- Bookmark Message
- Subscribe to Message
- Mute Message
- Subscribe to RSS Feed
- Permalink
- Report Inappropriate Content
Hi @poete, under my username->preferences, timezone was set to default. After changing this to my timezone and indexing data again, this issue got resolved. Thank you very much! Though the issue is resolved, am not still clear why data representation in the chart and table below were different, if both showed a different timestamp than what was there in the data indexed, I could understand.
- Mark as New
- Bookmark Message
- Subscribe to Message
- Mute Message
- Subscribe to RSS Feed
- Permalink
- Report Inappropriate Content
@sajithpv,
I turned the comment to an answer. Please accept it in order for other to find the answer more easily.

Join the Splunk Community Slack to learn, troubleshoot, and make connections with fellow Splunk practitioners in real time!
Join Splunk User Groups to connect and learn in-person by region or remotely by topic or industry.
From Data to Insight: Announcing the Winners of the Splunk Dashboard Contest
Splunk Developers: Construct Your Future at the .conf26 Builder Bar
Quick connection discovery mode for forwarders
