
Join the Conversation
- Find Answers
- :
- Using Splunk
- :
- Dashboards & Visualizations
- :
- Single view panel
- Subscribe to RSS Feed
- Mark Topic as New
- Mark Topic as Read
- Float this Topic for Current User
- Bookmark Topic
- Subscribe to Topic
- Mute Topic
- Printer Friendly Page
- Mark as New
- Bookmark Message
- Subscribe to Message
- Mute Message
- Subscribe to RSS Feed
- Permalink
- Report Inappropriate Content
Single view panel

Hi
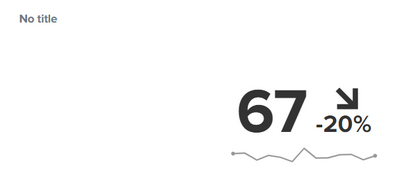
I have a dashboard where I display data in single view panels. I would like to show trends, but I want it customized. Right now my options are set to x amount days, months, seconds, ect. My situation is that I have three weeks of data that are averaged into a single value. So in my single view panel I want the data to show the current output compared to the % difference of the 3 week avg value.
Below I have the output displayed and the -20% showing the trend from one week ago.
What I want is for example my data from previous weeks are1 week ago = 50 , 2 week ago = 60, 3 week ago = 70 all averaged out comes to 60, so instead of the -20% I would like to see 10% ((67-60)/60)*100
(I use a time picker so all data is based of that, so for example if I select 'last 60 minutes' at 10 am the three weeks are based on 9 am - 10 am from 1 week ago, 9 am -10 am from 2 weeks ago, ect.)
Please let me know if you have questions.


Join the Splunk Community Slack to learn, troubleshoot, and make connections with fellow Splunk practitioners in real time!
Join Splunk User Groups to connect and learn in-person by region or remotely by topic or industry.
Agentic SOC Triage: Investigating Splunk ES Notables with MCP Server and a Local LLM
All Work and No Play? Not at .conf26! Unwind at These Evening Events
Join the Hackathon at .conf26 and build a No-Code AI agent
