Turn on suggestions
Auto-suggest helps you quickly narrow down your search results by suggesting possible matches as you type.
Dashboards & Visualizations
×
Join the Conversation
Without signing in, you're just watching from the sidelines. Sign in or Register to connect, share, and be part of the Splunk Community.
Turn on suggestions
Auto-suggest helps you quickly narrow down your search results by suggesting possible matches as you type.
- Find Answers
- :
- Using Splunk
- :
- Dashboards & Visualizations
- :
- Single Value: Current Server RAM Usage
Options
- Subscribe to RSS Feed
- Mark Topic as New
- Mark Topic as Read
- Float this Topic for Current User
- Bookmark Topic
- Subscribe to Topic
- Mute Topic
- Printer Friendly Page
- Mark as New
- Bookmark Message
- Subscribe to Message
- Mute Message
- Subscribe to RSS Feed
- Permalink
- Report Inappropriate Content
mxanareckless
Path Finder
02-10-2021
03:11 PM
I need a Single Value widget for a dashboard which displays current RAM usage in real-time.
This is what I have so far in SPL:
index=index host=host sourcetype=vmstat memUsedMB=*
| stats count
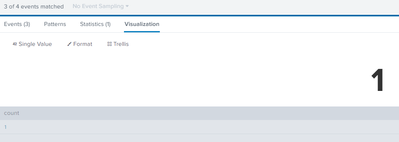
And this is all I'm getting:
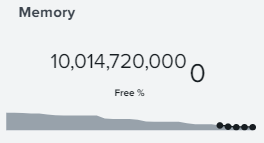
How can I get something more like this? :
1 Solution
- Mark as New
- Bookmark Message
- Subscribe to Message
- Mute Message
- Subscribe to RSS Feed
- Permalink
- Report Inappropriate Content
manjunathmeti
Champion
02-11-2021
01:51 AM
hi @mxanareckless,
Check if this works for you.
<dashboard>
  <label>Memory Usage</label>
  <row>
    <panel>
      <single>
        <title>Memory</title>
        <search>
          <query>index=index host=host sourcetype=vmstat memUsedMB=*
| stats latest(memUsedMB) as memUsedMB
| eval totalMem=10000 , freeMemPerc=(100*(totalMem-memUsedMB))/totalMem</query>
          <earliest>rt-1m</earliest>
          <latest>rt</latest>
          <progress>
            <set token="perc">$result.freeMemPerc$</set>
          </progress>
        </search>
        <option name="refresh.display">progressbar</option>
        <option name="showSparkline">0</option>
        <option name="showTrendIndicator">0</option>
        <option name="underLabel">Free $perc$ %.</option>
      </single>
    </panel>
  </row>
</dashboard>
If this reply helps you, an upvote/like would be appreciated.
- Mark as New
- Bookmark Message
- Subscribe to Message
- Mute Message
- Subscribe to RSS Feed
- Permalink
- Report Inappropriate Content
renjith_nair
Legend
02-10-2021
06:07 PM
Probably you should use
index=index host=host sourcetype=vmstat memUsedMB=*
| timechart max(memUsedMB) as memUsedMB
---
What goes around comes around. If it helps, hit it with Karma 🙂
What goes around comes around. If it helps, hit it with Karma 🙂
Get Updates on the Splunk Community!
Data Management Digest – December 2025
Welcome to the December edition of Data Management Digest!
As we continue our journey of data innovation, the ...
Index This | What is broken 80% of the time by February?
December 2025 Edition
Hayyy Splunk Education Enthusiasts and the Eternally Curious!
We’re back with this ...
Unlock Faster Time-to-Value on Edge and Ingest Processor with New SPL2 Pipeline ...
Hello Splunk Community,
We're thrilled to share an exciting update that will help you manage your data more ...


