Turn on suggestions
Auto-suggest helps you quickly narrow down your search results by suggesting possible matches as you type.
Dashboards & Visualizations
×
Join the Conversation
Without signing in, you're just watching from the sidelines. Sign in or Register to connect, share, and be part of the Splunk Community.
Turn on suggestions
Auto-suggest helps you quickly narrow down your search results by suggesting possible matches as you type.
- Find Answers
- :
- Using Splunk
- :
- Dashboards & Visualizations
- :
- Single Value: Current Server RAM Usage
Options
- Subscribe to RSS Feed
- Mark Topic as New
- Mark Topic as Read
- Float this Topic for Current User
- Bookmark Topic
- Subscribe to Topic
- Mute Topic
- Printer Friendly Page
- Mark as New
- Bookmark Message
- Subscribe to Message
- Mute Message
- Subscribe to RSS Feed
- Permalink
- Report Inappropriate Content
mxanareckless
Path Finder
02-10-2021
03:11 PM
I need a Single Value widget for a dashboard which displays current RAM usage in real-time.
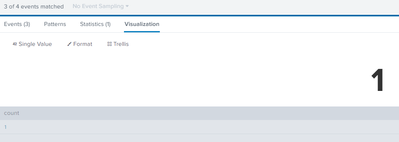
This is what I have so far in SPL:
index=index host=host sourcetype=vmstat memUsedMB=*
| stats count
And this is all I'm getting:
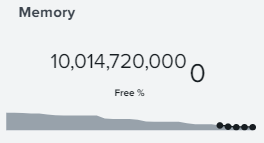
How can I get something more like this? :
1 Solution
- Mark as New
- Bookmark Message
- Subscribe to Message
- Mute Message
- Subscribe to RSS Feed
- Permalink
- Report Inappropriate Content
manjunathmeti
Champion
02-11-2021
01:51 AM
hi @mxanareckless,
Check if this works for you.
<dashboard>
  <label>Memory Usage</label>
  <row>
    <panel>
      <single>
        <title>Memory</title>
        <search>
          <query>index=index host=host sourcetype=vmstat memUsedMB=*
| stats latest(memUsedMB) as memUsedMB
| eval totalMem=10000 , freeMemPerc=(100*(totalMem-memUsedMB))/totalMem</query>
          <earliest>rt-1m</earliest>
          <latest>rt</latest>
          <progress>
            <set token="perc">$result.freeMemPerc$</set>
          </progress>
        </search>
        <option name="refresh.display">progressbar</option>
        <option name="showSparkline">0</option>
        <option name="showTrendIndicator">0</option>
        <option name="underLabel">Free $perc$ %.</option>
      </single>
    </panel>
  </row>
</dashboard>
If this reply helps you, an upvote/like would be appreciated.
- Mark as New
- Bookmark Message
- Subscribe to Message
- Mute Message
- Subscribe to RSS Feed
- Permalink
- Report Inappropriate Content
renjith_nair
Legend
02-10-2021
06:07 PM
Probably you should use
index=index host=host sourcetype=vmstat memUsedMB=*
| timechart max(memUsedMB) as memUsedMB
---
What goes around comes around. If it helps, hit it with Karma 🙂
What goes around comes around. If it helps, hit it with Karma 🙂
Get Updates on the Splunk Community!
The OpenTelemetry Certified Associate (OTCA) Exam
What’s this OTCA exam?
The Linux Foundation offers the OpenTelemetry Certified Associate (OTCA) credential to ...
From Manual to Agentic: Level Up Your SOC at Cisco Live
Welcome to the Era of the Agentic SOC
Are you tired of being a manual alert responder? The security ...
Splunk Classroom Chronicles: Training Tales and Testimonials (Episode 4)
Welcome back to Splunk Classroom Chronicles, our ongoing series where we shine a light on what really happens ...


