Join the Conversation
- Find Answers
- :
- Using Splunk
- :
- Dashboards & Visualizations
- :
- Re: How to add a search bar using Java script?
- Subscribe to RSS Feed
- Mark Topic as New
- Mark Topic as Read
- Float this Topic for Current User
- Bookmark Topic
- Subscribe to Topic
- Mute Topic
- Printer Friendly Page
- Mark as New
- Bookmark Message
- Subscribe to Message
- Mute Message
- Subscribe to RSS Feed
- Permalink
- Report Inappropriate Content
How to add a search bar using Java script?
I am trying to build a search bar and time range option to display the search results. According to the query given in the search bar, the result has to be displayed.
As per the post - https://community.splunk.com/t5/Dashboards-Visualizations/How-do-you-add-a-search-bar-without-Advanc...
I have taken the sample JS code to create search bar in my Splunk environment. I have added this sample code as search_bar.js under the directory $SPLUNK_HOME/apps/MyApp/appserver/static. Here is the sample code
var SearchBarView = require("splunkjs/mvc/searchbarview");
        new SearchBarView({
            id: "example-search-bar",
            managerid: "example-bar-search",
            el: $("#divToHangOn")
        }).render();

        var TableView = require("splunkjs/mvc/tableview");
        new TableView({
            id: "example-table",
            managerid: "example-bar-search",
            pageSize: "5",
            el: $("#divToHangOn2") // seperate div
        }).render();

        var SearchManager = require("splunkjs/mvc/searchmanager");
        new SearchManager({
            id: "example-bar-search",
            search: "index=_internal | head 100 | timechart count by sourcetype span=100s",
        });

        // Hooking up events
        var manager = splunkjs.mvc.Components.getInstance("example-bar-search");
        var searchbar = splunkjs.mvc.Components.getInstance("example-search-bar");
        var timerange = searchbar.timerange;

        searchbar.on("change", function() {
            manager.set("search", searchbar.val());
        });

        timerange.on("change", function() {
            manager.search.set(timerange.val());
        });
I have created a view/dashboard as search_sample.xml which is placed under the directory $SPLUNK_HOME/apps/MyApp/default/data/ui/views. Below is the code used in my dashboard
<dashboard script="search_bar.js">
    <label>Search app using JS</label>
    <row>
        <panel>
            <html>
                <table style="width:100%">
                    <tr>
                        <td style="width: 100%;">
                            <h3>Search</h3>
                            <div id="divToHangOn"></div>
                        </td>
                    </tr>
                    <tr>
                        <td style="width: 100%;">
                            <h3>Results</h3>
                            <div id="divToHangOn2"></div>
                        </td>
                    </tr>
                </table>
            </html>
        </panel>
    </row>
</dashboard>
I am not getting the results as expected. Even after refreshing/restarting the Splunk app, I am getting label and heading which is used in the dashboard code.
I am unable to get the search bar with time range to enter the required search query. Not sure where the issue is lying with.
Could anyone please help me on this.
- Mark as New
- Bookmark Message
- Subscribe to Message
- Mute Message
- Subscribe to RSS Feed
- Permalink
- Report Inappropriate Content
@niketn The Search query is returning the results only after the whole search is completed.
For example, I have entered my search query (in which the respective index have more events), then selected the Time range of 24 hours and ran the search. The search is running, finding the logs for the respective query but its not displaying as soon as it find.
Once the query completes it search for the whole selected time range, only then its showing the result set.
I am expecting the result to be shown as soon as the search query find the first result instead of waiting till the search completes.
Any idea how can we get this?
- Mark as New
- Bookmark Message
- Subscribe to Message
- Mute Message
- Subscribe to RSS Feed
- Permalink
- Report Inappropriate Content
@niketn I have tried the code from the post which you have mentioned. But I did not get the required results.
I have placed the Java script file in the path $SPLUNK_HOME/apps/MyApp/appserver/static and the dashboard file in the path$SPLUNK_HOME/apps/MyApp/default/data/ui/views.
After refreshing the complete Splunk configuration, I tried to access the dashboard from the Splunk UI. It was neither showing the search bar with query nor the query results.
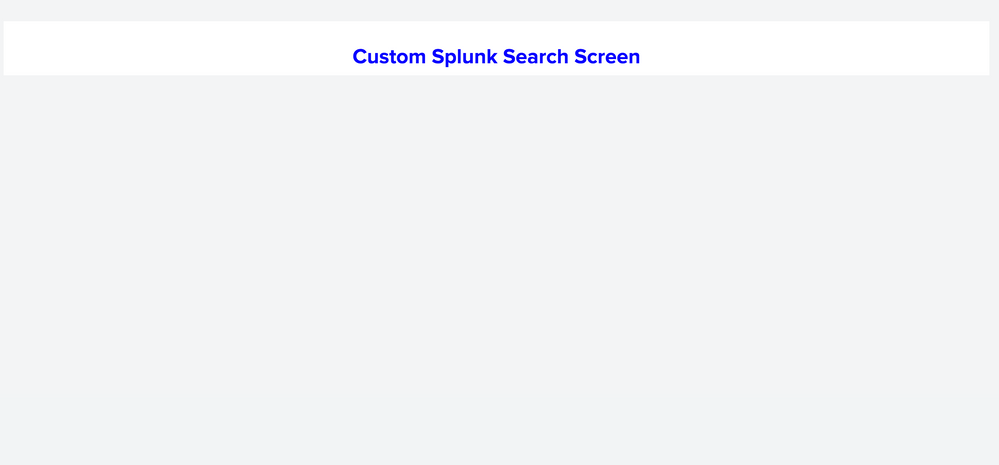
Its just showing the text as "Custom Splunk Search Screen", as mentioned in the xml file. Below I have attached the screenshot of the dashboard.
I need this feature to be working as soon as possible. Not sure which is causing the issue over here.
Could you please help me in fixing this issue.
- Mark as New
- Bookmark Message
- Subscribe to Message
- Mute Message
- Subscribe to RSS Feed
- Permalink
- Report Inappropriate Content
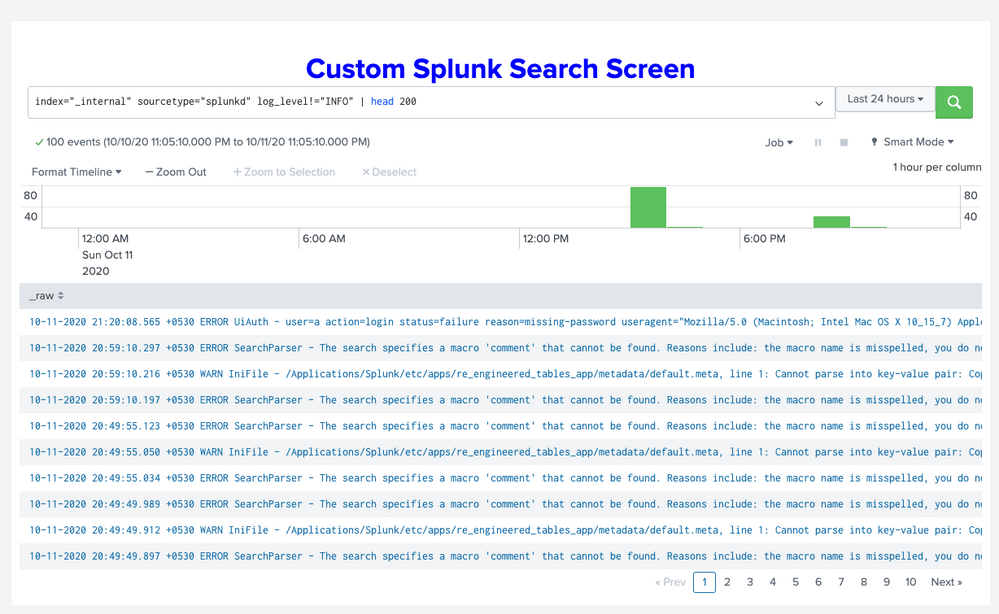
@akarivaratharaj which version of Splunk are you using? Also when you open Browser Inspector do you seen any Console Log Errors? Hope you have tried bump, refresh, restart of Splunk in your Dev environment and also internet browser history cleanup. In order to test JS being picked up you can try changing the Browser URL to the JS file. For example since we are using JS searchcontrolsevents.js file, you can try the following (http or https depending on your Dev environment setup). PS: App folder name is case-sensitive hope MyApp is spelled with correct casing). If it opens the JS then it implies JS is in the right path. You should verify the code as well. In the JS code block you can add console.log("My Custom Search UI"); as first piece of JS code before declaring submitted and default token model. This can help you debug further or atleast confirm whether JS is loading and has not syntax errors.
http(s)://<yourSplunkURL:port>/en-US/static/app/MyApp/searchcontrolsevents.jsWhile my previous answer was from 2017, I just tested in version 8.0.5 and it works as expected. (Latest screenshot attached for reference).
| makeresults | eval message= "Happy Splunking!!!"
- Mark as New
- Bookmark Message
- Subscribe to Message
- Mute Message
- Subscribe to RSS Feed
- Permalink
- Report Inappropriate Content
@niketn As per your screenshot attached, you get the events as the search query results in the Smart mode itself. But I could not view the event results in the Smart mode, whereas I have to manually switch to fast mode even for a very simple query like
index=main source=abc sourcetype=xyz host=*
Please let me know how to view the log events without switching to any mode manually.
Also the results are not in a readable way, to view an event, I need to scroll to right till the end. Is there any way to view the events in a readable way, without scrolling? Something like wrapping the content to it's dashboard size. So that it will be user friendly to view the complete event
- Mark as New
- Bookmark Message
- Subscribe to Message
- Mute Message
- Subscribe to RSS Feed
- Permalink
- Report Inappropriate Content
Cool..!! I got the expected view with search bar, timerange, timeline with results. I have just tried accessing the dashboard from different browser it worked. But not sure why this is still not working with Google chrome.
Another thing is, apart from the default query of "index=_internal...", I have given my own query and tried. I just tried with the index and sourcetype where my sample logs are available.
"index=xx sourcetype=yy"
The results for this query is displayed in a table format where the fields and the respective values are displayed as each column. I tried to see the raw events, but could not find the option even after changing the mode to Verbose.
Any idea on this?
- Mark as New
- Bookmark Message
- Subscribe to Message
- Mute Message
- Subscribe to RSS Feed
- Permalink
- Report Inappropriate Content
@niketn I would like to view the raw events similar to what we get from Search app. Any idea how can we get this please
- Mark as New
- Bookmark Message
- Subscribe to Message
- Mute Message
- Subscribe to RSS Feed
- Permalink
- Report Inappropriate Content
Actually I can see the raw data, if I click on the fast mode. Even if you know any other way, please let me know.
- Mark as New
- Bookmark Message
- Subscribe to Message
- Mute Message
- Subscribe to RSS Feed
- Permalink
- Report Inappropriate Content
I am using the version of 8.0.6. There is no error when I open the Browser Inspector from the respective dashboard page
- Mark as New
- Bookmark Message
- Subscribe to Message
- Mute Message
- Subscribe to RSS Feed
- Permalink
- Report Inappropriate Content
Also you might not have access to Internal index (i.e. _internal) so try changing to an index which you may have access to.
| makeresults | eval message= "Happy Splunking!!!"
- Mark as New
- Bookmark Message
- Subscribe to Message
- Mute Message
- Subscribe to RSS Feed
- Permalink
- Report Inappropriate Content
@akarivaratharaj try the other debug steps I have mentioned. Hope that will help at-least figuring out where the issue is.
| makeresults | eval message= "Happy Splunking!!!"
- Mark as New
- Bookmark Message
- Subscribe to Message
- Mute Message
- Subscribe to RSS Feed
- Permalink
- Report Inappropriate Content
@akarivaratharaj try one of my older answers on similar lines: https://community.splunk.com/t5/Dashboards-Visualizations/How-to-change-app-banner-css-when-open-sea...
If it does not work post details on error/issue like screenshot from UI or Console error.
| makeresults | eval message= "Happy Splunking!!!"


