
Join the Conversation
- Find Answers
- :
- Using Splunk
- :
- Dashboards & Visualizations
- :
- Re: Help me with Pie Chart
- Subscribe to RSS Feed
- Mark Topic as New
- Mark Topic as Read
- Float this Topic for Current User
- Bookmark Topic
- Subscribe to Topic
- Mute Topic
- Printer Friendly Page
- Mark as New
- Bookmark Message
- Subscribe to Message
- Mute Message
- Subscribe to RSS Feed
- Permalink
- Report Inappropriate Content

Hi,
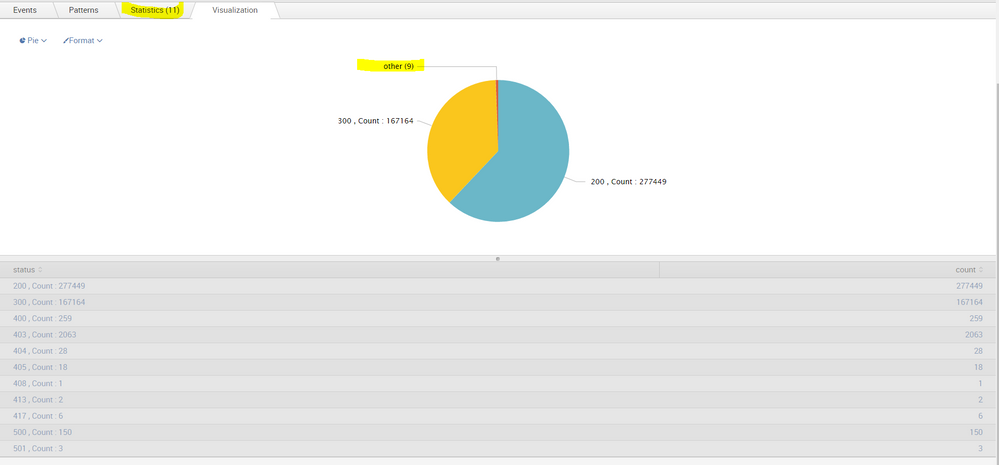
Pie Chart is not displaying all the value (where i have 11 values)
Pie chart is displaying "other" When the count of Statistics>10.
i want to diplay all the values in pie chart.
Please help me with this.

- Mark as New
- Bookmark Message
- Subscribe to Message
- Mute Message
- Subscribe to RSS Feed
- Permalink
- Report Inappropriate Content
Try this
<option name="charting.chart.sliceCollapsingThreshold">0.0000001</option>
- Mark as New
- Bookmark Message
- Subscribe to Message
- Mute Message
- Subscribe to RSS Feed
- Permalink
- Report Inappropriate Content
Try this
<option name="charting.chart.sliceCollapsingThreshold">0.0000001</option>
- Mark as New
- Bookmark Message
- Subscribe to Message
- Mute Message
- Subscribe to RSS Feed
- Permalink
- Report Inappropriate Content
Hey Sravn
Try this
Go to pie chart --> format --> set the minimum size to 0.01%
As some of your values are pretty much small when compared to the others that might be a reason
sliceCollapsingThreshold number The threshold at which smaller slices should be collapsed into a consolidated slice. Valid values are between 0 (no collapsing) and 1 (all slices are collapsed into a single pie). 0.01 (slices smaller than 1% of the whole pie are collapsed)
- Mark as New
- Bookmark Message
- Subscribe to Message
- Mute Message
- Subscribe to RSS Feed
- Permalink
- Report Inappropriate Content

Basically, the problem is that your other values, even all added together, are so small that they are just not significant in relation to the 440K+ counts in the two main categories -- they sum to about a half a percent, so that's only a 2 degree visual slice, divided between the nine categories.
A pie chart is just not a good way to represent those lesser categories. I haven't seen a "3-D funnel" visualization in splunk, but that might be a good way to go here, based on your data.
If you really want to put them in there, I'd suggest to either do it on a second, smaller pie chart, or add a table of their nominal values.
The alternative might be to override the name or stats of the "Other" category so as to display the whole mini-table with a mouse-hover. I'm pretty sure that can be done, although it might require quite a bit of work.

Join the Splunk Community Slack to learn, troubleshoot, and make connections with fellow Splunk practitioners in real time!
Join Splunk User Groups to connect and learn in-person by region or remotely by topic or industry.
Tuning Edge Processor in Hybrid Mode: What Limits Each Data Path
Best Practices: Splunk auto adjust pipeline queue
Request for Professional Development: Attending .conf26
