Turn on suggestions
Auto-suggest helps you quickly narrow down your search results by suggesting possible matches as you type.
Dashboards & Visualizations
×
Join the Conversation
Without signing in, you're just watching from the sidelines. Sign in or Register to connect, share, and be part of the Splunk Community.
- Find Answers
- :
- Using Splunk
- :
- Dashboards & Visualizations
- :
- Re: Gantt Chart without SplunkBase plugins
Options
- Subscribe to RSS Feed
- Mark Topic as New
- Mark Topic as Read
- Float this Topic for Current User
- Bookmark Topic
- Subscribe to Topic
- Mute Topic
- Printer Friendly Page
- Mark as New
- Bookmark Message
- Subscribe to Message
- Mute Message
- Subscribe to RSS Feed
- Permalink
- Report Inappropriate Content
Gantt Chart without SplunkBase plugins
CarbonCriterium
Path Finder
09-02-2020
08:14 AM
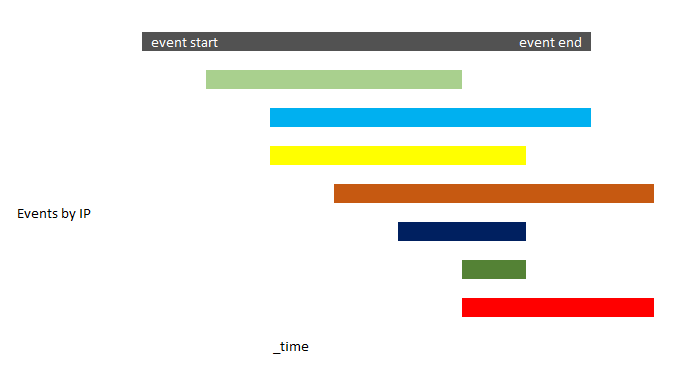
I am looking to visualize the start and end time of events by IP within a very narrow time frame.
The attached image show what I imagine the visualization to look like. I guess this would use the horizontal bar chart?
Can one create this type of visualization in Splunk without additional plugins?
- Mark as New
- Bookmark Message
- Subscribe to Message
- Mute Message
- Subscribe to RSS Feed
- Permalink
- Report Inappropriate Content
richgalloway

SplunkTrust
09-02-2020
08:28 AM
Splunk bar charts are always left-justified so they won't fill your need. There are apps available, however, to produce Gantt-style charts.
---
If this reply helps you, Karma would be appreciated.
If this reply helps you, Karma would be appreciated.
- Mark as New
- Bookmark Message
- Subscribe to Message
- Mute Message
- Subscribe to RSS Feed
- Permalink
- Report Inappropriate Content
CarbonCriterium
Path Finder
09-02-2020
09:25 AM
Thank you for the reply but it doesn't really help. I am looking to create a Gantt style chart without incorporating additional plugins or apps

Got questions? Get answers!
Join the Splunk Community Slack to learn, troubleshoot, and make connections with fellow Splunk practitioners in real time!
Meet up IRL or virtually!
Join Splunk User Groups to connect and learn in-person by region or remotely by topic or industry.
Get Updates on the Splunk Community!
Best Practices: Splunk auto adjust pipeline queue
When you enable autoAdjustQueue in Splunk, maxSize should be understood as the queue size Splunk starts with ...
Laser Bananas and Edge Hubs: Exploring Operational Technology (OT) Data Through a ...
OT is a different environment to traditional IT and can have interesting challenges when interfacing the ...
Event Series: Mastering AI Tokenomics and Splunk Agent Observability
Beyond the Black Box: Correlating AI Performance and Tokenomics with Splunk Agent Observability
As ...
