
Turn on suggestions
Auto-suggest helps you quickly narrow down your search results by suggesting possible matches as you type.
Dashboards & Visualizations
×
Join the Conversation
Without signing in, you're just watching from the sidelines. Sign in or Register to connect, share, and be part of the Splunk Community.
- Find Answers
- :
- Using Splunk
- :
- Dashboards & Visualizations
- :
- Re: Dashboard CSS: Stack SingleValue Panel
Options
- Subscribe to RSS Feed
- Mark Topic as New
- Mark Topic as Read
- Float this Topic for Current User
- Bookmark Topic
- Subscribe to Topic
- Mute Topic
- Printer Friendly Page
- Mark as New
- Bookmark Message
- Subscribe to Message
- Mute Message
- Subscribe to RSS Feed
- Permalink
- Report Inappropriate Content

morethanyell
Builder
08-01-2019
09:37 PM
Hi,
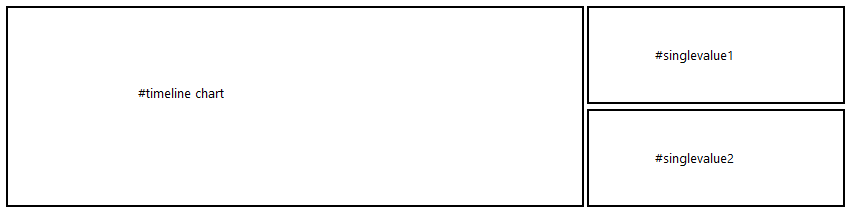
How do we write CSS to achieve layout shown on the screenshot? I've tried the CSS below but it's not working
<html>
    <style>
        #timelinechart{
            width:75% !important;
            height:100% !important;
        }
        #singlevalue1{
            width:25% !important;
            height:50% !important;
        }
        #singlevalue2{
            width:25% !important;
            height:50% !important;
        }
    </style>
</html>
1 Solution
- Mark as New
- Bookmark Message
- Subscribe to Message
- Mute Message
- Subscribe to RSS Feed
- Permalink
- Report Inappropriate Content

niketn
Legend
08-01-2019
11:13 PM
@morethanyell you can refer to one of my older answers to stack single values and adjust as per your needs.
https://answers.splunk.com/answers/717452/how-to-stack-two-data-element-visualizations.html
____________________________________________
| makeresults | eval message= "Happy Splunking!!!"
| makeresults | eval message= "Happy Splunking!!!"
- Mark as New
- Bookmark Message
- Subscribe to Message
- Mute Message
- Subscribe to RSS Feed
- Permalink
- Report Inappropriate Content

woodcock
Esteemed Legend
08-06-2019
09:13 AM
This can be done with Sideview Utils which is a much more flexible dashboarding framework for splunk built by an ex-employee. @sideview can tell you more.
- Mark as New
- Bookmark Message
- Subscribe to Message
- Mute Message
- Subscribe to RSS Feed
- Permalink
- Report Inappropriate Content
niketn
Legend
08-01-2019
11:13 PM
@morethanyell you can refer to one of my older answers to stack single values and adjust as per your needs.
https://answers.splunk.com/answers/717452/how-to-stack-two-data-element-visualizations.html
____________________________________________
| makeresults | eval message= "Happy Splunking!!!"
| makeresults | eval message= "Happy Splunking!!!"



Got questions? Get answers!
Join the Splunk Community Slack to learn, troubleshoot, and make connections with fellow Splunk practitioners in real time!
Meet up IRL or virtually!
Join Splunk User Groups to connect and learn in-person by region or remotely by topic or industry.
Get Updates on the Splunk Community!
Deep Dive: Optimizing Telemetry Pipelines in Splunk Observability Cloud
In this session, we will peel back the layers of Splunk Observability Cloud’s cost-optimization features. ...
Announcing Modern Navigation: A New Era of Splunk User Experience
We are excited to introduce the Modern Navigation feature in the Splunk Platform, available to both cloud and ...
Data Drivers: How We're Streaming Real-Time F1 Telemetry Directly into Splunk ...
Data Drivers: Every Lap Tells a Story
The Spectacle
Two F1 racing sims go head-to-head on the .conf26 show ...
