
Join the Conversation
- Find Answers
- :
- Using Splunk
- :
- Dashboards & Visualizations
- :
- Choropleth Map, count by counties
- Subscribe to RSS Feed
- Mark Topic as New
- Mark Topic as Read
- Float this Topic for Current User
- Bookmark Topic
- Subscribe to Topic
- Mute Topic
- Printer Friendly Page
- Mark as New
- Bookmark Message
- Subscribe to Message
- Mute Message
- Subscribe to RSS Feed
- Permalink
- Report Inappropriate Content

Hello All,
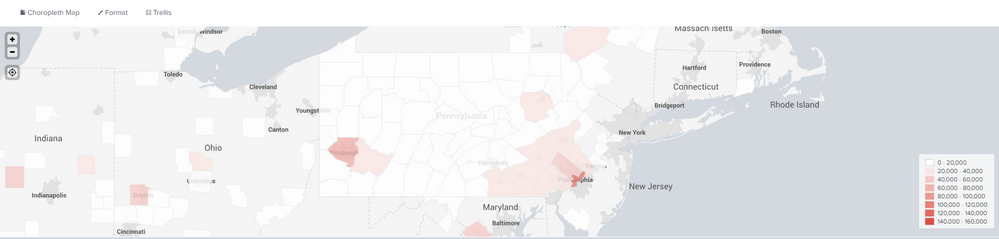
I am trying to visualize data in a choropleth map using shapefiles. My goal is to show a count of a field by county in PA. I have yet to find a well configured shapefile for all counties in PA, so I had to use one for the counties in all of the US. Unfortunately when I use the geom command this includes any other counties of the same name in the map vis. Is there a way to filter out other states and just include PA? or can I set bounds for this map so it only visualizes PA?
Image of Choropleth map as is
Search:
sourcetype=*sourcetype* province=Pennsylvania
| stats latest(*stats*) as "*name*" by county
| geom nat_counties_lookup featureIdField=county
- Mark as New
- Bookmark Message
- Subscribe to Message
- Mute Message
- Subscribe to RSS Feed
- Permalink
- Report Inappropriate Content
Solved using this blog to make my own kml file using a shapefile: https://www.splunk.com/en_us/blog/tips-and-tricks/use-custom-polygons-in-your-choropleth-maps.html
- Mark as New
- Bookmark Message
- Subscribe to Message
- Mute Message
- Subscribe to RSS Feed
- Permalink
- Report Inappropriate Content
Solved using this blog to make my own kml file using a shapefile: https://www.splunk.com/en_us/blog/tips-and-tricks/use-custom-polygons-in-your-choropleth-maps.html


Join the Splunk Community Slack to learn, troubleshoot, and make connections with fellow Splunk practitioners in real time!
Join Splunk User Groups to connect and learn in-person by region or remotely by topic or industry.
Agentic SOC Triage: Investigating Splunk ES Notables with MCP Server and a Local LLM
All Work and No Play? Not at .conf26! Unwind at These Evening Events
Join the Hackathon at .conf26 and build a No-Code AI agent
