Turn on suggestions
Auto-suggest helps you quickly narrow down your search results by suggesting possible matches as you type.
Showing results for
All Apps and Add-ons
Turn on suggestions
Auto-suggest helps you quickly narrow down your search results by suggesting possible matches as you type.
Showing results for
- Apps and Add-ons
- :
- All Apps and Add-ons
- :
- WEBSITE MONITORING: Change response Time History C...
Options
- Subscribe to RSS Feed
- Mark Topic as New
- Mark Topic as Read
- Float this Topic for Current User
- Bookmark Topic
- Subscribe to Topic
- Mute Topic
- Printer Friendly Page
- Mark as New
- Bookmark Message
- Subscribe to Message
- Mute Message
- Subscribe to RSS Feed
- Permalink
- Report Inappropriate Content
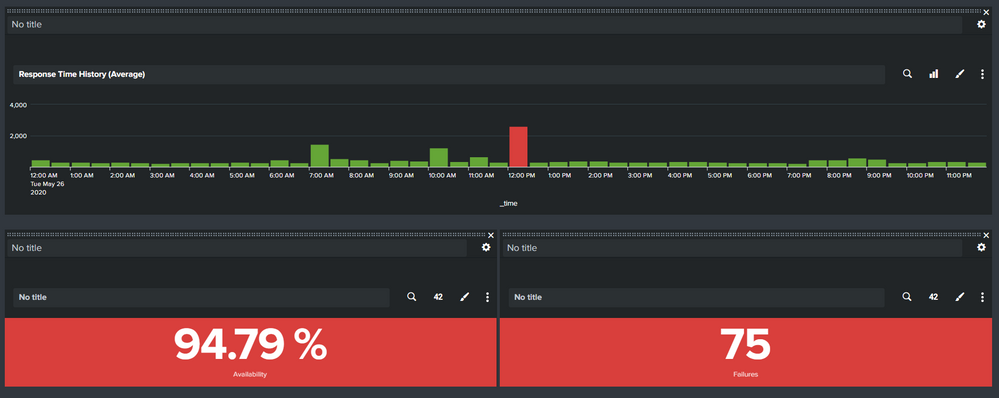
WEBSITE MONITORING: Change response Time History Chart to display red on failure not response time
nathanluke86
Communicator
06-02-2020
02:10 AM
I am trying to alter the response Time History Chart to display a red bar when a failure occurs and not when a response time threshold is met.
sourcetype="web_ping" `website_monitoring_search_index` title="$title$" | timechart avg(total_time) as response_time | eval response_time_over_threshold=if(response_time>`response_time_threshold`,response_time,0) | eval response_time=if(response_time>`response_time_threshold`,0,response_time)
TIA
- Mark as New
- Bookmark Message
- Subscribe to Message
- Mute Message
- Subscribe to RSS Feed
- Permalink
- Report Inappropriate Content
493669
Super Champion
06-02-2020
03:42 AM
How did you identify that failure is occurred?
- Mark as New
- Bookmark Message
- Subscribe to Message
- Mute Message
- Subscribe to RSS Feed
- Permalink
- Report Inappropriate Content
nathanluke86
Communicator
06-04-2020
12:17 AM
Hi @493669
failures occur based on response_code for example a 503 error
Thanks
Get Updates on the Splunk Community!
Enter the Splunk Community Dashboard Challenge for Your Chance to Win!
The Splunk Community Dashboard Challenge is underway! This is your chance to showcase your skills in creating ...
.conf24 | Session Scheduler is Live!!
.conf24 is happening June 11 - 14 in Las Vegas, and we are thrilled to announce that the conference catalog ...
Introducing the Splunk Community Dashboard Challenge!
Welcome to Splunk Community Dashboard Challenge! This is your chance to showcase your skills in creating ...

