Turn on suggestions
Auto-suggest helps you quickly narrow down your search results by suggesting possible matches as you type.
All Apps and Add-ons
×
Join the Conversation
Without signing in, you're just watching from the sidelines. Sign in or Register to connect, share, and be part of the Splunk Community.
Turn on suggestions
Auto-suggest helps you quickly narrow down your search results by suggesting possible matches as you type.
- Find Answers
- :
- Apps & Add-ons
- :
- All Apps and Add-ons
- :
- WEBSITE MONITORING: Change response Time History C...
Options
- Subscribe to RSS Feed
- Mark Topic as New
- Mark Topic as Read
- Float this Topic for Current User
- Bookmark Topic
- Subscribe to Topic
- Mute Topic
- Printer Friendly Page
- Mark as New
- Bookmark Message
- Subscribe to Message
- Mute Message
- Subscribe to RSS Feed
- Permalink
- Report Inappropriate Content
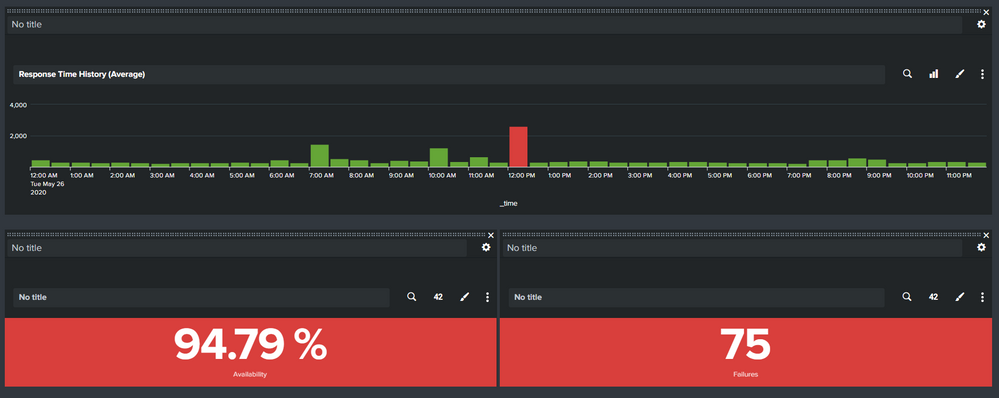
WEBSITE MONITORING: Change response Time History Chart to display red on failure not response time
nathanluke86
Communicator
06-02-2020
02:10 AM
I am trying to alter the response Time History Chart to display a red bar when a failure occurs and not when a response time threshold is met.
sourcetype="web_ping" `website_monitoring_search_index` title="$title$" | timechart avg(total_time) as response_time | eval response_time_over_threshold=if(response_time>`response_time_threshold`,response_time,0) | eval response_time=if(response_time>`response_time_threshold`,0,response_time)
TIA
- Mark as New
- Bookmark Message
- Subscribe to Message
- Mute Message
- Subscribe to RSS Feed
- Permalink
- Report Inappropriate Content
493669
Super Champion
06-02-2020
03:42 AM
How did you identify that failure is occurred?
- Mark as New
- Bookmark Message
- Subscribe to Message
- Mute Message
- Subscribe to RSS Feed
- Permalink
- Report Inappropriate Content
nathanluke86
Communicator
06-04-2020
12:17 AM
Hi @493669
failures occur based on response_code for example a 503 error
Thanks
Get Updates on the Splunk Community!
Splunk Observability for AI
Don’t miss out on an exciting Tech Talk on Splunk Observability for AI!
Discover how Splunk’s agentic AI ...
[Puzzles] Solve, Learn, Repeat: Dereferencing XML to Fixed-length events
This challenge was first posted on Slack #puzzles channelFor a previous puzzle, I needed a set of fixed-length ...
Stay Connected: Your Guide to December Tech Talks, Office Hours, and Webinars!
What are Community Office Hours?
Community Office Hours is an interactive 60-minute Zoom series where ...

