Are you a member of the Splunk Community?
- Find Answers
- :
- Using Splunk
- :
- Splunk Search
- :
- Re: How to determine which deployment server a for...
- Subscribe to RSS Feed
- Mark Topic as New
- Mark Topic as Read
- Float this Topic for Current User
- Bookmark Topic
- Subscribe to Topic
- Mute Topic
- Printer Friendly Page
- Mark as New
- Bookmark Message
- Subscribe to Message
- Mute Message
- Subscribe to RSS Feed
- Permalink
- Report Inappropriate Content
I have multiple deployment servers.The global deployment server is to distribute basic configurations and also configurations for the forwarder to connect to a regional deployment server.
I want to create a dashboard to monitor which deployment server a forwarder is currently reporting to. How do I get the deployment server that a forwarder is currently connected to ?
Any advise would be greatly appreciated. Thanks!
- Mark as New
- Bookmark Message
- Subscribe to Message
- Mute Message
- Subscribe to RSS Feed
- Permalink
- Report Inappropriate Content
Give this a try
index=_internal sourcetype=splunkd component=PubSubSvr | rex "\/handshake\/reply\/(?P<DeploymentClient>[^\/]+)" | stats count by host DeploymentClient | rename host as DeploymentServer | fields - count
- Mark as New
- Bookmark Message
- Subscribe to Message
- Mute Message
- Subscribe to RSS Feed
- Permalink
- Report Inappropriate Content
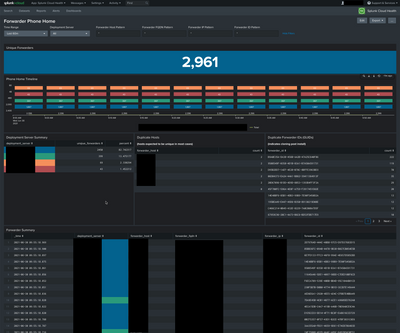
Dashboard to show forwarder phone home counts per deployment server with host fqdn ip guid
Requires you to route your deployment server splunkd.log to your indexers in a distributed environment.
<form theme="dark">
<label>Forwarder Phone Home</label>
<fieldset submitButton="false">
<input type="time" token="time" searchWhenChanged="true">
<label>Time Range</label>
<default>
<earliest>-60m@m</earliest>
<latest>now</latest>
</default>
</input>
<input type="dropdown" token="deployment_server" searchWhenChanged="true">
<label>Deployment Server</label>
<choice value="*">All</choice>
<fieldForLabel>host</fieldForLabel>
<fieldForValue>host</fieldForValue>
<search>
<query>index=_internal sourcetype=splunkd_access "phonehome/connection"
| dedup host
| table host
| sort host</query>
<earliest>-24h@h</earliest>
<latest>now</latest>
</search>
<default>*</default>
</input>
<input type="text" token="forwarder_host_pattern" searchWhenChanged="true">
<label>Forwarder Host Pattern</label>
<default>*</default>
</input>
<input type="text" token="forwarder_fqdn_pattern" searchWhenChanged="true">
<label>Forwarder FQDN Pattern</label>
<default>*</default>
</input>
<input type="text" token="forwarder_ip_pattern" searchWhenChanged="true">
<label>Forwarder IP Pattern</label>
<default>*</default>
</input>
<input type="text" token="forwarder_id_pattern">
<label>Forwarder ID Pattern</label>
<default>*</default>
</input>
</fieldset>
<row>
<panel>
<title>Unique Forwarders</title>
<single>
<search>
<query>index=_internal sourcetype=splunkd_access "phonehome/connection" host="$deployment_server$"
| rex "phonehome/connection_(?<forwarder_ip>[^\_]+)_80\d\d_(?<forwarder_fqdn>[^\_]+)_(?<forwarder_host>[^\_]+)_(?<forwarder_id>[^\s]+)"
| search forwarder_host="*$forwarder_host_pattern$*" forwarder_fqdn="*$forwarder_fqdn_pattern$*" forwarder_ip="*$forwarder_ip_pattern$*" forwarder_id="*$forwarder_id_pattern$*"
| dedup forwarder_host forwarder_fqdn forwarder_ip forwarder_id
| stats count</query>
<earliest>-5m</earliest>
<latest>now</latest>
<sampleRatio>1</sampleRatio>
<refresh>5m</refresh>
<refreshType>delay</refreshType>
</search>
<option name="colorMode">block</option>
<option name="drilldown">none</option>
<option name="rangeColors">["0x006d9c","0x006d9c"]</option>
<option name="rangeValues">[0]</option>
<option name="refresh.display">progressbar</option>
<option name="useColors">1</option>
</single>
</panel>
</row>
<row>
<panel>
<title>Phone Home Timeline</title>
<chart>
<search>
<query>index=_internal sourcetype=splunkd_access "phonehome/connection"
| rex "phonehome/connection_(?<forwarder_ip>[^\_]+)_80\d\d_(?<forwarder_fqdn>[^\_]+)_(?<forwarder_host>[^\_]+)_(?<forwarder_id>[^\s]+)"
| search forwarder_host="*$forwarder_host_pattern$*" forwarder_fqdn="*$forwarder_fqdn_pattern$*" forwarder_ip="*$forwarder_ip_pattern$*" forwarder_id="*$forwarder_id_pattern$*" host="$deployment_server$"
| eval device=forwarder_ip+"-"+forwarder_id
| bucket _time span=5m
| dedup _time forwarder_id
| timechart partial=false span=5m dc(device) as unqiue_forwarders by host
| rename host as deployment_server
| addtotals</query>
<earliest>$time.earliest$</earliest>
<latest>$time.latest$</latest>
<sampleRatio>1</sampleRatio>
<refresh>5m</refresh>
<refreshType>delay</refreshType>
</search>
<option name="charting.axisTitleX.visibility">collapsed</option>
<option name="charting.axisTitleY.visibility">collapsed</option>
<option name="charting.axisY.scale">linear</option>
<option name="charting.chart">column</option>
<option name="charting.chart.overlayFields">Total</option>
<option name="charting.chart.showDataLabels">all</option>
<option name="charting.chart.stackMode">stacked</option>
<option name="charting.drilldown">none</option>
<option name="charting.layout.splitSeries">1</option>
<option name="charting.layout.splitSeries.allowIndependentYRanges">1</option>
<option name="charting.legend.placement">bottom</option>
<option name="refresh.display">progressbar</option>
</chart>
</panel>
</row>
<row>
<panel>
<title>Deployment Server Summary</title>
<table>
<search>
<query>index=_internal sourcetype=splunkd_access "phonehome/connection" host="$deployment_server$"
| rex "phonehome/connection_(?<forwarder_ip>[^\_]+)_80\d\d_(?<forwarder_fqdn>[^\_]+)_(?<forwarder_host>[^\_]+)_(?<forwarder_id>[^\s]+)"
| search forwarder_host="*$forwarder_host_pattern$*" forwarder_fqdn="*$forwarder_fqdn_pattern$*" forwarder_ip="*$forwarder_ip_pattern$*" forwarder_id="*$forwarder_id_pattern$*"
| dedup forwarder_ip forwarder_id
| top host
| rename host as deployment_server count as unqiue_forwarders</query>
<earliest>-5m</earliest>
<latest>now</latest>
<sampleRatio>1</sampleRatio>
<refresh>5m</refresh>
<refreshType>delay</refreshType>
</search>
<option name="count">10</option>
<option name="drilldown">none</option>
<option name="refresh.display">progressbar</option>
<format type="color" field="deployment_server">
<colorPalette type="sharedList"></colorPalette>
<scale type="sharedCategory"></scale>
</format>
</table>
</panel>
<panel>
<title>Duplicate Hosts</title>
<table>
<title>(hosts expected to be unique in most cases)</title>
<search>
<query>index=_internal sourcetype=splunkd_access "phonehome/connection" host="$deployment_server$"
| rex "phonehome/connection_(?<forwarder_ip>[^\_]+)_80\d\d_(?<forwarder_fqdn>[^\_]+)_(?<forwarder_host>[^\_]+)_(?<forwarder_id>[^\s]+)"
| search forwarder_host="*$forwarder_host_pattern$*" forwarder_fqdn="*$forwarder_fqdn_pattern$*" forwarder_ip="*$forwarder_ip_pattern$*" forwarder_id="*$forwarder_id_pattern$*"
| dedup forwarder_host forwarder_fqdn forwarder_ip forwarder_id
| stats count by forwarder_host
| search count>1
| sort -count
| append
[| makeresults
| eval count=0
| table count ]</query>
<earliest>-5m</earliest>
<latest>now</latest>
<sampleRatio>1</sampleRatio>
<refresh>5m</refresh>
<refreshType>delay</refreshType>
</search>
<option name="count">10</option>
<option name="drilldown">none</option>
</table>
</panel>
<panel>
<title>Duplicate Forwarder IDs (GUIDs)</title>
<table>
<title>(indicates cloning post install)</title>
<search>
<query>index=_internal sourcetype=splunkd_access "phonehome/connection" host="$deployment_server$"
| rex "phonehome/connection_(?<forwarder_ip>[^\_]+)_80\d\d_(?<forwarder_fqdn>[^\_]+)_(?<forwarder_host>[^\_]+)_(?<forwarder_id>[^\s]+)"
| search forwarder_host="*$forwarder_host_pattern$*" forwarder_fqdn="*$forwarder_fqdn_pattern$*" forwarder_ip="*$forwarder_ip_pattern$*" forwarder_id="*$forwarder_id_pattern$*"
| dedup forwarder_host forwarder_fqdn forwarder_ip forwarder_id
| stats count by forwarder_id
| search count>1
| sort -count
| append
[| makeresults
| eval count=0
| table count ]</query>
<earliest>-5m</earliest>
<latest>now</latest>
<sampleRatio>1</sampleRatio>
<refresh>5m</refresh>
<refreshType>delay</refreshType>
</search>
<option name="count">10</option>
<option name="drilldown">none</option>
<option name="refresh.display">progressbar</option>
</table>
</panel>
</row>
<row>
<panel>
<title>Forwarder Summary</title>
<table>
<search>
<query>index=_internal sourcetype=splunkd_access "phonehome/connection"
| rex "phonehome/connection_(?<forwarder_ip>[^\_]+)_80\d\d_(?<forwarder_fqdn>[^\_]+)_(?<forwarder_host>[^\_]+)_(?<forwarder_id>[^\s]+)"
| search forwarder_host="*$forwarder_host_pattern$*" forwarder_fqdn="*$forwarder_fqdn_pattern$*" forwarder_ip="*$forwarder_ip_pattern$*" forwarder_id="*$forwarder_id_pattern$*" host="$deployment_server$"
| dedup forwarder_host forwarder_fqdn forwarder_ip forwarder_id
| table _time host forwarder_host forwarder_fqdn forwarder_ip forwarder_id
| rename host as deployment_server</query>
<earliest>$time.earliest$</earliest>
<latest>$time.latest$</latest>
<sampleRatio>1</sampleRatio>
<refresh>5m</refresh>
<refreshType>delay</refreshType>
</search>
<option name="count">40</option>
<option name="dataOverlayMode">none</option>
<option name="drilldown">none</option>
<option name="percentagesRow">false</option>
<option name="refresh.display">progressbar</option>
<option name="rowNumbers">true</option>
<option name="totalsRow">false</option>
<option name="wrap">true</option>
<format type="color" field="deployment_server">
<colorPalette type="sharedList"></colorPalette>
<scale type="sharedCategory"></scale>
</format>
</table>
</panel>
</row>
</form>
- Mark as New
- Bookmark Message
- Subscribe to Message
- Mute Message
- Subscribe to RSS Feed
- Permalink
- Report Inappropriate Content
If you have access to the forwarder, you could run the CLI command to see what it's pointed to also;
$SPLUNK_HOME/bin/splunk show deploy-poll
http://docs.splunk.com/Documentation/Splunk/6.4.2/Admin/CLIadmincommands
- Mark as New
- Bookmark Message
- Subscribe to Message
- Mute Message
- Subscribe to RSS Feed
- Permalink
- Report Inappropriate Content
Give this a try
index=_internal sourcetype=splunkd component=PubSubSvr | rex "\/handshake\/reply\/(?P<DeploymentClient>[^\/]+)" | stats count by host DeploymentClient | rename host as DeploymentServer | fields - count
- Mark as New
- Bookmark Message
- Subscribe to Message
- Mute Message
- Subscribe to RSS Feed
- Permalink
- Report Inappropriate Content
This worked for me. However i need IP address of UF from the logs. How i can get those.
- Mark as New
- Bookmark Message
- Subscribe to Message
- Mute Message
- Subscribe to RSS Feed
- Permalink
- Report Inappropriate Content
Maybe the following thread can point you in the right direction - How to determine if forwarder is phoning home to deployment server
It shows there -
 index=_internal (*phonehome* component=DC*) OR (component=DC:HandshakeReplyHandler) host=hostname
 | sort _time
 | table _time host log_level message

