Are you a member of the Splunk Community?
- Find Answers
- :
- Using Splunk
- :
- Dashboards & Visualizations
- :
- Re: Ever wonder which dashboards are being used an...
- Subscribe to RSS Feed
- Mark Topic as New
- Mark Topic as Read
- Float this Topic for Current User
- Bookmark Topic
- Subscribe to Topic
- Mute Topic
- Printer Friendly Page
- Mark as New
- Bookmark Message
- Subscribe to Message
- Mute Message
- Subscribe to RSS Feed
- Permalink
- Report Inappropriate Content
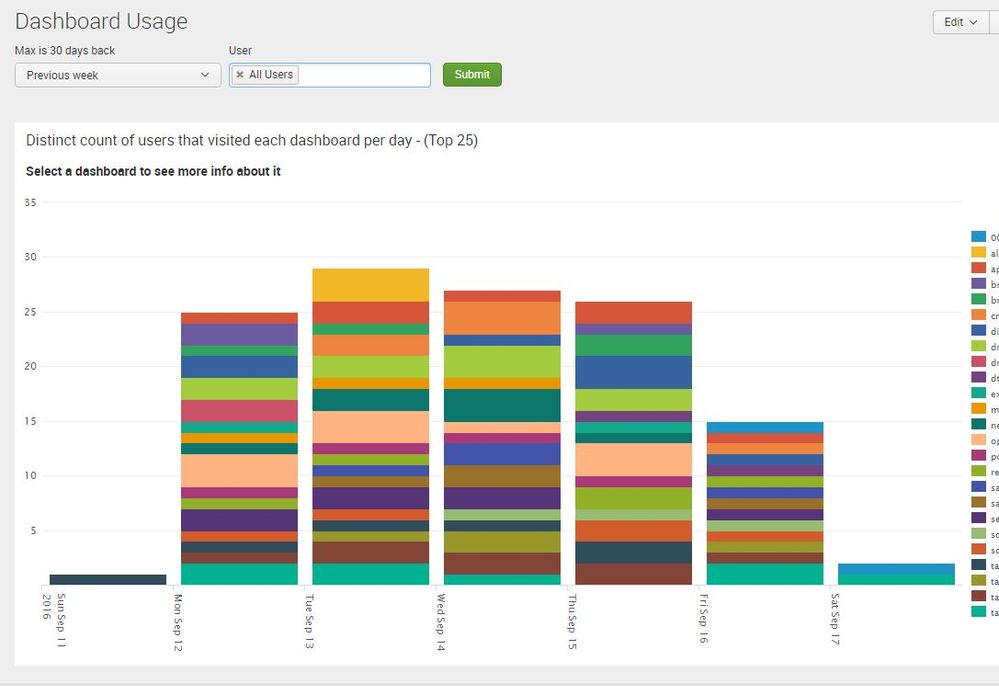
The dashboard below should help answer that question for you.
The User dropdown uses a |rest search to get a list of LDAP users so if you don't have access to run | rest or aren't using LDAP then that dropdown won't populate but the dashboard will still work fine you just won't be able to look at all dashboard usage for a single user.
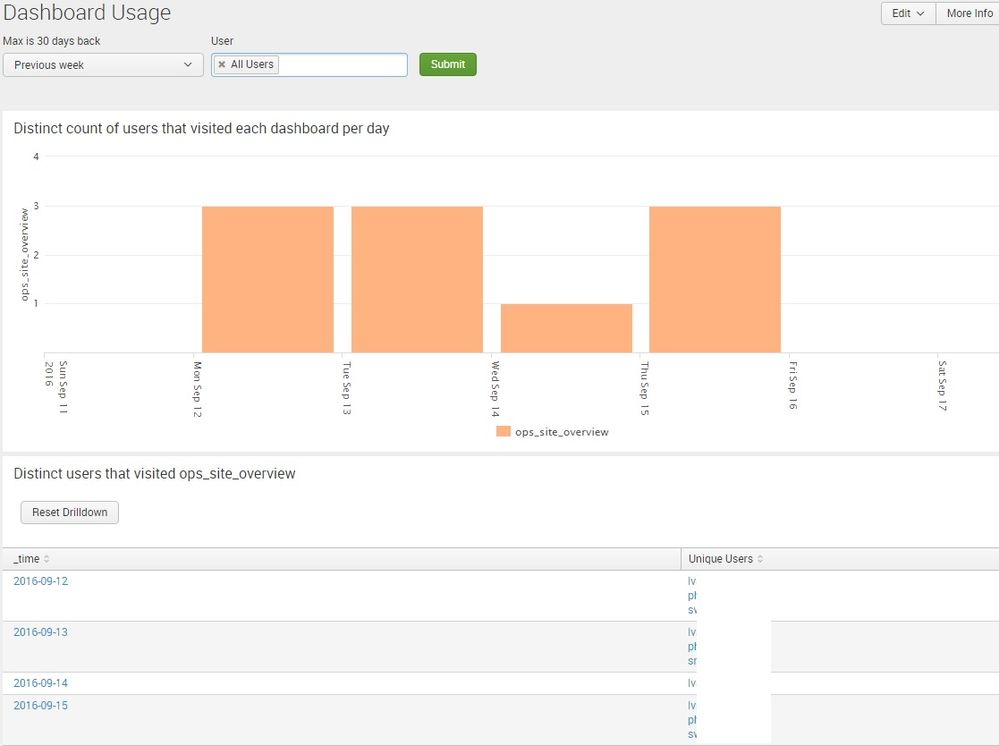
You can drilldown on any dashboard that shows in the chart to see the specific users that are using the dashboard per day. To go back to the main chart select the "Reset Drilldown" button.
NOTE - You will need the tokenlinks.js available for the reset button to work. I got it from the 6.x Dashboard Examples App.
 <form script="tokenlinks.js">
    <label>Dashboard Usage</label>
    <fieldset submitButton="true">
      <input type="time" token="field1">
        <label>Max is 30 days back</label>
        <default>
          <earliest>-3d@d</earliest>
          <latest>now</latest>
        </default>
      </input>
      <input type="multiselect" token="user">
        <label>User</label>
        <choice value="*">All Users</choice>
        <search>
          <query>|rest /services/authentication/users splunk_server=local
   |fields title type realname|rename title as userName|rename realname as Name | search type=LDAP | eval display=userName+" - "+Name | fields userName display</query>
        </search>
        <fieldForLabel>display</fieldForLabel>
        <fieldForValue>userName</fieldForValue>
        <default>*</default>
        <prefix>user=</prefix>
        <delimiter> OR user=</delimiter>
      </input>
    </fieldset>
    <search id="baseDashboardUse">
        <query>index="_internal" user!="-"  sourcetype=splunkd_ui_access "en-US/app"  | rex field=referer "en-US/app/(?<app>[^/]+)/(?<dashboard>[^?/\s]+)" | search  dashboard!="job_management" dashboard!="dbinfo" dashboard!="*en-US" dashboard!="search" dashboard!="home" dashboard!="alerts" dashboard!="dashboards" dashboard!="reports" dashboard!="report" | bucket _time span=1d | stats dc(dashboard) as c by dashboard user _time  </query>
        <earliest>$field1.earliest$</earliest>
        <latest>$field1.latest$</latest>
     </search>
    <row>
      <panel depends="$field1.earliest$" rejects="$dashboard$">
        <title>Distinct count of users that visited each dashboard per day - (Top 25)</title>
        <chart>
          <title>Select a dashboard to see more info about it</title>
          <search base="baseDashboardUse">
            <query>search $user$ | timechart span=1d limit=25 useother=f count by dashboard</query>
          </search>
          <option name="charting.axisLabelsX.majorLabelStyle.overflowMode">ellipsisNone</option>
          <option name="charting.axisLabelsX.majorLabelStyle.rotation">90</option>
          <option name="charting.axisTitleX.visibility">collapsed</option>
          <option name="charting.axisTitleY.visibility">visible</option>
          <option name="charting.axisTitleY2.visibility">visible</option>
          <option name="charting.axisX.scale">linear</option>
          <option name="charting.axisY.scale">linear</option>
          <option name="charting.axisY2.enabled">0</option>
          <option name="charting.axisY2.scale">inherit</option>
          <option name="charting.chart">column</option>
          <option name="charting.chart.bubbleMaximumSize">50</option>
          <option name="charting.chart.bubbleMinimumSize">10</option>
          <option name="charting.chart.bubbleSizeBy">area</option>
          <option name="charting.chart.nullValueMode">gaps</option>
          <option name="charting.chart.showDataLabels">none</option>
          <option name="charting.chart.sliceCollapsingThreshold">0.01</option>
          <option name="charting.chart.stackMode">stacked</option>
          <option name="charting.chart.style">shiny</option>
          <option name="charting.drilldown">all</option>
          <drilldown>
            <set token="dashboard">$click.name2$</set>
          </drilldown>
          <option name="charting.layout.splitSeries">0</option>
          <option name="charting.layout.splitSeries.allowIndependentYRanges">0</option>
          <option name="charting.legend.labelStyle.overflowMode">ellipsisMiddle</option>
          <option name="charting.legend.placement">right</option>
          <option name="height">800</option>
        </chart>
      </panel>
    </row>
    <row>
      <panel depends="$dashboard$">
        <title>Distinct count of users that visited each dashboard per day</title>
        <chart>
          <search base="baseDashboardUse">
            <query>search dashboard=$dashboard$ | timechart span=1d limit=25 useother=f count by dashboard</query>
          </search>
          <option name="charting.axisLabelsX.majorLabelStyle.overflowMode">ellipsisNone</option>
          <option name="charting.axisLabelsX.majorLabelStyle.rotation">90</option>
          <option name="charting.axisTitleX.visibility">collapsed</option>
          <option name="charting.axisTitleY.visibility">visible</option>
          <option name="charting.axisTitleY2.visibility">visible</option>
          <option name="charting.axisX.scale">linear</option>
          <option name="charting.axisY.scale">linear</option>
          <option name="charting.axisY2.enabled">0</option>
          <option name="charting.axisY2.scale">inherit</option>
          <option name="charting.chart">column</option>
          <option name="charting.chart.bubbleMaximumSize">50</option>
          <option name="charting.chart.bubbleMinimumSize">10</option>
          <option name="charting.chart.bubbleSizeBy">area</option>
          <option name="charting.chart.nullValueMode">gaps</option>
          <option name="charting.chart.showDataLabels">none</option>
          <option name="charting.chart.sliceCollapsingThreshold">0.01</option>
          <option name="charting.chart.stackMode">stacked</option>
          <option name="charting.chart.style">shiny</option>
          <option name="charting.drilldown">none</option>
          <option name="charting.layout.splitSeries">0</option>
          <option name="charting.layout.splitSeries.allowIndependentYRanges">0</option>
          <option name="charting.legend.labelStyle.overflowMode">ellipsisMiddle</option>
          <option name="charting.legend.placement">bottom</option>
          <option name="height">400</option>
        </chart>
      </panel>
    </row>
    <row>
      <panel>
        <title>Distinct users that visited $dashboard$</title>
        <html depends="$dashboard$">
           <button class="btn" data-unset-token="dashboard">Reset Drilldown</button>
        </html>
        <table depends="$dashboard$">
         <search base="baseDashboardUse">
            <query>search dashboard=$dashboard$ | stats values(user) as "Unique Users" by _time</query>
         </search>
          <option name="wrap">true</option>
          <option name="rowNumbers">false</option>
          <option name="dataOverlayMode">none</option>
          <option name="drilldown">cell</option>
          <option name="count">10</option>
        </table>
      </panel>
    </row>
  </form>
- Mark as New
- Bookmark Message
- Subscribe to Message
- Mute Message
- Subscribe to RSS Feed
- Permalink
- Report Inappropriate Content
If this helped you upvote this to show that it would be nice to have more dashboards like this out of the box for admins to see what users are doing. If you used this and made any enhancements/changes please comment below so all of us can benefit from them.
Thanks!
- Mark as New
- Bookmark Message
- Subscribe to Message
- Mute Message
- Subscribe to RSS Feed
- Permalink
- Report Inappropriate Content
appears it is the rex..... it is extracting any fields.... I'll poke at it
- Mark as New
- Bookmark Message
- Subscribe to Message
- Mute Message
- Subscribe to RSS Feed
- Permalink
- Report Inappropriate Content
errrr correction.... it is NOT extracting any fields
- Mark as New
- Bookmark Message
- Subscribe to Message
- Mute Message
- Subscribe to RSS Feed
- Permalink
- Report Inappropriate Content
appears I do not have a referer field for the rex to extract from. I wonder if this is because that I'm using Splunk Cloud?
rex field=referer <-referer field does not exist on our instance of Splunk Cloud
- Mark as New
- Bookmark Message
- Subscribe to Message
- Mute Message
- Subscribe to RSS Feed
- Permalink
- Report Inappropriate Content
Which mode are you running your search on? These are internal events and all Field extractions should be setup.
- Mark as New
- Bookmark Message
- Subscribe to Message
- Mute Message
- Subscribe to RSS Feed
- Permalink
- Report Inappropriate Content
I'm running in Verbose mode. If I run a very basic query
index="_internal" sourcetype=splunkd_ui_access
There is no referer field
Simplifying the query even further
index="_internal"
I get more fields but still no referer field.
I checked "more fields" each time as well
- Mark as New
- Bookmark Message
- Subscribe to Message
- Mute Message
- Subscribe to RSS Feed
- Permalink
- Report Inappropriate Content
finally got it
index="_internal" source=/opt/splunk/var/log/splunk/splunkd_ui_access.log "en-US/app" | rex "(?i)^[^\-]*\-\s+(?P<user>[^ ]+)" | rex "en-US/app/(?<app>[^/]+)/(?<dashboard>[^?/\"\s]+)"| search app="search" dashboard!="job_management" dashboard!="dbinfo" dashboard!="*en-US" dashboard!="search" dashboard!="home" dashboard!="alert*" dashboard!="dashboards" dashboard!="reports" dashboard!="report" dashboard!="@go" dashboard!="%40go" dashboard!="field_extractor" dashboard!="pivot" user!="-"|bucket _time span=1d | stats dc(dashboard) as c by dashboard user _time | eval ud=user." - ".dashboard| timechart useother=f count by ud |
- Mark as New
- Bookmark Message
- Subscribe to Message
- Mute Message
- Subscribe to RSS Feed
- Permalink
- Report Inappropriate Content
I'm running this query under just the plain ole search app.
I got further along by this query
index="_internal" sourcetype=splunkd_ui_access | rex "en-US/app/(?<app>[^/]+)/(?<dashboard>[^?/\s]+)" |search app="search" dashboard!="job_management" dashboard!="dbinfo" dashboard!="*en-US" dashboard!="search" dashboard!="home" dashboard!="alerts" dashboard!="dashboards" dashboard!="reports" dashboard!="report"| bucket _time span=1d|stats dc(dashboard) as c by dashboard
but when I add user after dashboard it falls over because..... there is no user field.....
- Mark as New
- Bookmark Message
- Subscribe to Message
- Mute Message
- Subscribe to RSS Feed
- Permalink
- Report Inappropriate Content
there is however a form_user field that contains my username
- Mark as New
- Bookmark Message
- Subscribe to Message
- Mute Message
- Subscribe to RSS Feed
- Permalink
- Report Inappropriate Content
This kinda sorta gets close. Still not useful but its closer......
index="_internal" sourcetype=splunkd_ui_access | rex "en-US/app/(?<app>[^/]+)/(?<dashboard>[^?/\s]+)" |search app="search" dashboard!="job_management" dashboard!="dbinfo" dashboard!="*en-US" dashboard!="search" dashboard!="home" dashboard!="alerts" dashboard!="dashboards" dashboard!="reports" dashboard!="report"| bucket _time span=1h|stats dc(dashboard) as c by dashboard _time| timechart span=1h limit=25 useother=f count by dashboard
- Mark as New
- Bookmark Message
- Subscribe to Message
- Mute Message
- Subscribe to RSS Feed
- Permalink
- Report Inappropriate Content
closer still
index="_internal" source=/opt/splunk/var/log/splunk/splunkd_ui_access.log "en-US/app"| rex "(?i)^[^\-]*\-\s+(?P<user>[^ ]+)"| rex "en-US/app/(?<app>[^/]+)/(?<dashboard>[^?/\s]+)" |search app="search" dashboard!="job_management" dashboard!="dbinfo" dashboard!="*en-US" dashboard!="search" dashboard!="home" dashboard!="alerts" dashboard!="dashboards" dashboard!="reports" dashboard!="report"| bucket _time span=1h|stats dc(dashboard) as c by dashboard user _time| timechart span=1h limit=25 useother=f count by dashboard
- Mark as New
- Bookmark Message
- Subscribe to Message
- Mute Message
- Subscribe to RSS Feed
- Permalink
- Report Inappropriate Content
Very strange.... I can see the same fields in my Splunk Cloud (trial), so that's not the issue. Under which app you're running the search?..
- Mark as New
- Bookmark Message
- Subscribe to Message
- Mute Message
- Subscribe to RSS Feed
- Permalink
- Report Inappropriate Content
using index=_internal sourcetype=splunkd_ui_access referer=*
No results found
- Mark as New
- Bookmark Message
- Subscribe to Message
- Mute Message
- Subscribe to RSS Feed
- Permalink
- Report Inappropriate Content
How about this
index=_internal sourcetype=splunkd_ui_access referer=*
- Mark as New
- Bookmark Message
- Subscribe to Message
- Mute Message
- Subscribe to RSS Feed
- Permalink
- Report Inappropriate Content
Dumb question, but where do I add tokenlinks.js? If I add it to appserver/static, I still don't see a reset button.
Edit: leaving this up here because I'm impatient. It does show up.
- Mark as New
- Bookmark Message
- Subscribe to Message
- Mute Message
- Subscribe to RSS Feed
- Permalink
- Report Inappropriate Content
If this helped you upvote this to show that it would be nice to have more dashboards like this out of the box for admins to see what users are doing. If you used this and made any enhancements/changes please comment below so all of us can benefit from them.
Thanks!
- Mark as New
- Bookmark Message
- Subscribe to Message
- Mute Message
- Subscribe to RSS Feed
- Permalink
- Report Inappropriate Content
This is very useful. However, to make it work on a Windows install I had to change:
source="/opt/splunk/var/log/splunk/splunkd_ui_access.log"
to
source="*splunkd_ui_access.log"
- Mark as New
- Bookmark Message
- Subscribe to Message
- Mute Message
- Subscribe to RSS Feed
- Permalink
- Report Inappropriate Content
This is good. Here are my changes:-
1) Replace all source references using splunkd_ui_acc.log references to just "sourcetype=splunkd_ui_access", as it'll always work regardless of OS, install directory etc. changes.
2) Remove app=search filter as there can be dashboard in different app
3) Used post-process for performance improvement.
- Mark as New
- Bookmark Message
- Subscribe to Message
- Mute Message
- Subscribe to RSS Feed
- Permalink
- Report Inappropriate Content
Somesoni2 I have changed the source= to your recommended sourcetype= instead. Thanks for the suggestion.
Do you mind posting your post-processed xml? I can edit the original as well with those changes to help future users of this.


