Join the Conversation
- Find Answers
- :
- Apps & Add-ons
- :
- All Apps and Add-ons
- :
- Re: Parsing Splunk log
- Subscribe to RSS Feed
- Mark Topic as New
- Mark Topic as Read
- Float this Topic for Current User
- Bookmark Topic
- Subscribe to Topic
- Mute Topic
- Printer Friendly Page
- Mark as New
- Bookmark Message
- Subscribe to Message
- Mute Message
- Subscribe to RSS Feed
- Permalink
- Report Inappropriate Content
Hi Teams,
I am newbie to splunk, I have log message like this:
| 4/5/22 6:03:22.697 PM |
2022-04-05T10:03:22.697Z 802cf235-b8d6-454e-bb1a-25d16f6b5f21 INFO 802cf235-b8d6-454e-bb1a-25d16f6b5f21 INFO: Insert batch 0/6 END RequestId: 802cf235-b8d6-454e-bb1a-25d16f6b5f21 REPORT RequestId: 802cf235-b8d6-454e-bb1a-25d16f6b5f21 Duration: 601.44 ms Billed Duration: 602 ms Memory Size: 1024 MB Max Memory Used: 97 MB
|
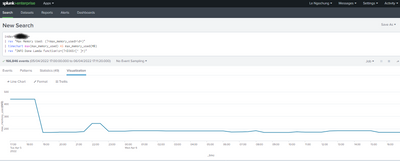
I want to get Max Memory Used value in each message and create time chart to show Max Memory Used value and the Max Memory Used average value. Can anyone help me in this!
- Mark as New
- Bookmark Message
- Subscribe to Message
- Mute Message
- Subscribe to RSS Feed
- Permalink
- Report Inappropriate Content
Hi @hungln9,
in general, you have to find a rule to apply the regex: if in your case you want the string after INFo, you could use a regex like this:
| rex "INFO\s+(?<instance>[^ ]+)"Tell me if I can help you more, otherwise, please, accept my answer for the other people of Community.
Ciao.
Giuseppe
P.S.: Karma Points are appreciated 😉
- Mark as New
- Bookmark Message
- Subscribe to Message
- Mute Message
- Subscribe to RSS Feed
- Permalink
- Report Inappropriate Content
Many thanks @gcusello ,
That is exactly what I need.
Can I ask you 1 more things?
I want to include the instances infomation to the chart, in this message is INFO 802cf235-b8d6-454e-bb1a-25d16f6b5f21, can you guide me:
| 4/5/22 6:03:22.697 PM | 2022-04-05T10:03:22.697Z 802cf235-b8d6-454e-bb1a-25d16f6b5f21 INFO 802cf235-b8d6-454e-bb1a-25d16f6b5f21 INFO: Insert batch 0/6 END RequestId: 802cf235-b8d6-454e-bb1a-25d16f6b5f21 REPORT RequestId: 802cf235-b8d6-454e-bb1a-25d16f6b5f21 Duration: 601.44 ms Billed Duration: 602 ms Memory Size: 1024 MB Max Memory Used: 97 MB |
- Mark as New
- Bookmark Message
- Subscribe to Message
- Mute Message
- Subscribe to RSS Feed
- Permalink
- Report Inappropriate Content
Hi @hungln9,
in general, you have to find a rule to apply the regex: if in your case you want the string after INFo, you could use a regex like this:
| rex "INFO\s+(?<instance>[^ ]+)"Tell me if I can help you more, otherwise, please, accept my answer for the other people of Community.
Ciao.
Giuseppe
P.S.: Karma Points are appreciated 😉
- Mark as New
- Bookmark Message
- Subscribe to Message
- Mute Message
- Subscribe to RSS Feed
- Permalink
- Report Inappropriate Content
Thanks for your support, @gcusello
I mean that I have a lot of instances(instance1, instance2....), and I want to show all of them on only 1 time chart, can you tell me, how can I do that?
- Mark as New
- Bookmark Message
- Subscribe to Message
- Mute Message
- Subscribe to RSS Feed
- Permalink
- Report Inappropriate Content
Hi @hungln9,
it mainly depends on how many instances you have to display.
There a limit in chart but it's very high (hundreds of bars), the main limit is the readability of your chart.
maybe you could create more panels displaying a group of instances.
Ciao.
Giuseppe
P.S.: Karma Points are appreciated 😉
- Mark as New
- Bookmark Message
- Subscribe to Message
- Mute Message
- Subscribe to RSS Feed
- Permalink
- Report Inappropriate Content
Hi @gcusello ,
I have many sources in search result, can you guide me how can I group some resource into 1 chart?
index=my_index*
| rex "Max Memory Used: (?<max_memory_used>\d+)"
| timechart max(max_memory_used) AS max_memory_used by source
I tried to group with this query, but seem it's incorrect:
index=my_index* (source=source1 or source=2)
| rex "Max Memory Used: (?<max_memory_used>\d+)"
| timechart max(max_memory_used) AS max_memory_used by source
- Mark as New
- Bookmark Message
- Subscribe to Message
- Mute Message
- Subscribe to RSS Feed
- Permalink
- Report Inappropriate Content
Hi @hungln9,
it's always better to ask a new question to the Community, so more people can help you better and quicker!
Anyway, using the second search, you use the same grouping options than the first but you filter your results (in teh main search) taking only events from two sources.
if it doesn't run. check the "(source=source1 OR source=source2)" condition and check if the regex you used is correct for those events..
Anyway, probably host could be more interesting than source.
Ciao.
Giuseppe
- Mark as New
- Bookmark Message
- Subscribe to Message
- Mute Message
- Subscribe to RSS Feed
- Permalink
- Report Inappropriate Content
Many thanks @gcusello ,
I have other question in Comunity, if you are free please help me take a look on that:
- Mark as New
- Bookmark Message
- Subscribe to Message
- Mute Message
- Subscribe to RSS Feed
- Permalink
- Report Inappropriate Content
Many thanks @gcusello ,
I want to create send email alert when "max memory used" is greater than 1024.
I'm trying to save search results as alert, but can not find the way to set or define this condition.
Can you please guide me?
- Mark as New
- Bookmark Message
- Subscribe to Message
- Mute Message
- Subscribe to RSS Feed
- Permalink
- Report Inappropriate Content
Hi @hungln9.,
put this condition at the end of your search and set your alert to trigger when results>0:
index=your_index
| rex "INFO\s+(?<instance>[^ ]+)"
| timechart max(max_memory_used) AS max_memory_used
| where max_memory_used>1024
Ciao.
Giuseppe
- Mark as New
- Bookmark Message
- Subscribe to Message
- Mute Message
- Subscribe to RSS Feed
- Permalink
- Report Inappropriate Content
Thanks for your support @gcusello
I tried to add condition, but seem it not work, even I tried with value=10
index=my_index*
| rex "Max Memory Used: (?<max_memory_used>\d+)"
| timechart max(max_memory_used) AS max_memory_used(MB)
| rex "INFO Done Lamda function\s+(?<D365>[^ ]+)"
|where max_memory_used>10
While without condition, It worked
index=my_index*
| rex "Max Memory Used: (?<max_memory_used>\d+)"
| timechart max(max_memory_used) AS max_memory_used(MB)
| rex "INFO Done Lamda function\s+(?<D365>[^ ]+)"
Can you pls take a look on this!
- Mark as New
- Bookmark Message
- Subscribe to Message
- Mute Message
- Subscribe to RSS Feed
- Permalink
- Report Inappropriate Content
Hi @hungln9,
in the timechart, you renamed "max_memory_used(MB)" whilein the where condition you used "max_memory_used" that's different!
Ciao.
Giuseppe
P.S.: Karma Points are appreciated 😉
- Mark as New
- Bookmark Message
- Subscribe to Message
- Mute Message
- Subscribe to RSS Feed
- Permalink
- Report Inappropriate Content
Hi @gcusello ,
Sorry for many question from me.
I have new trouble
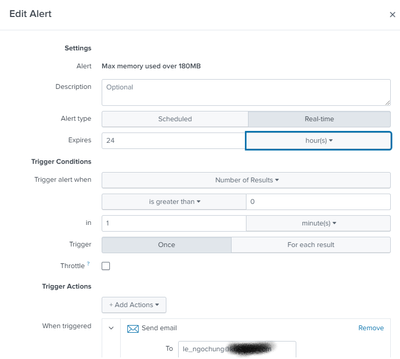
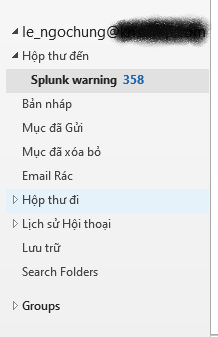
I already created alert to send notify email to me once the max memory used is over. But I recevied a lot email notify in 1 minute, once alert was triggered. I just want to trigger action send me 1 or some notify, Could you please guide me?
- Mark as New
- Bookmark Message
- Subscribe to Message
- Mute Message
- Subscribe to RSS Feed
- Permalink
- Report Inappropriate Content
Hi @hungln9,
no problems for your questions!
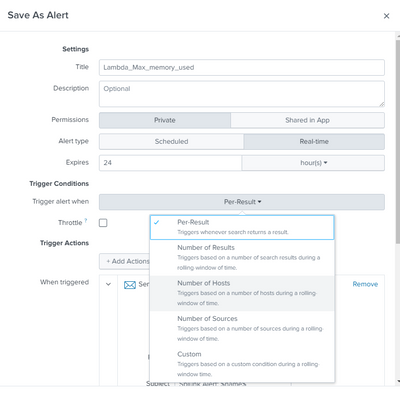
Anyway, in this case you have to configure throttle in your alert, the period, after a triggering that the alert doesn't run.
You can find it in the Alert definition.
Ciao.
Giuseppe
- Mark as New
- Bookmark Message
- Subscribe to Message
- Mute Message
- Subscribe to RSS Feed
- Permalink
- Report Inappropriate Content
Many thanks @gcusello ,
This is thing, what I need
- Mark as New
- Bookmark Message
- Subscribe to Message
- Mute Message
- Subscribe to RSS Feed
- Permalink
- Report Inappropriate Content
- Mark as New
- Bookmark Message
- Subscribe to Message
- Mute Message
- Subscribe to RSS Feed
- Permalink
- Report Inappropriate Content
Many thanks @gcusello ,
My problem was solved, no issue at all.
- Mark as New
- Bookmark Message
- Subscribe to Message
- Mute Message
- Subscribe to RSS Feed
- Permalink
- Report Inappropriate Content
Hi @hungln9,
good for you, see next time!
Ciao and happy splunking
iuseppe
P.S.: Karma Points are appreciated 😉
- Mark as New
- Bookmark Message
- Subscribe to Message
- Mute Message
- Subscribe to RSS Feed
- Permalink
- Report Inappropriate Content
hi @hungln9,
if you're sure that the maxmemory is always expressed in MB, you could run something like this:
index=your_index
| rex "Max Memory Used: (?<max_memory_used>\d+)"
| timechart max(max_memory_used) AS max_memory_used
if instead you could also have GB, you should modify a little the search:
index=your_index
| rex "Max Memory Used: (?<max_memory_used>\d+)\s+(?<mem_unit>\w+)"
| eval max_memory_used=if(mem_unit="GB",max_memory_used*1024,max_memory_used)
| timechart max(max_memory_used) AS max_memory_used
Ciao.
Giuseppe


