Are you a member of the Splunk Community?
- Find Answers
- :
- Using Splunk
- :
- Splunk Search
- :
- how to show accumulated sum over bin of time
- Subscribe to RSS Feed
- Mark Topic as New
- Mark Topic as Read
- Float this Topic for Current User
- Bookmark Topic
- Subscribe to Topic
- Mute Topic
- Printer Friendly Page
- Mark as New
- Bookmark Message
- Subscribe to Message
- Mute Message
- Subscribe to RSS Feed
- Permalink
- Report Inappropriate Content
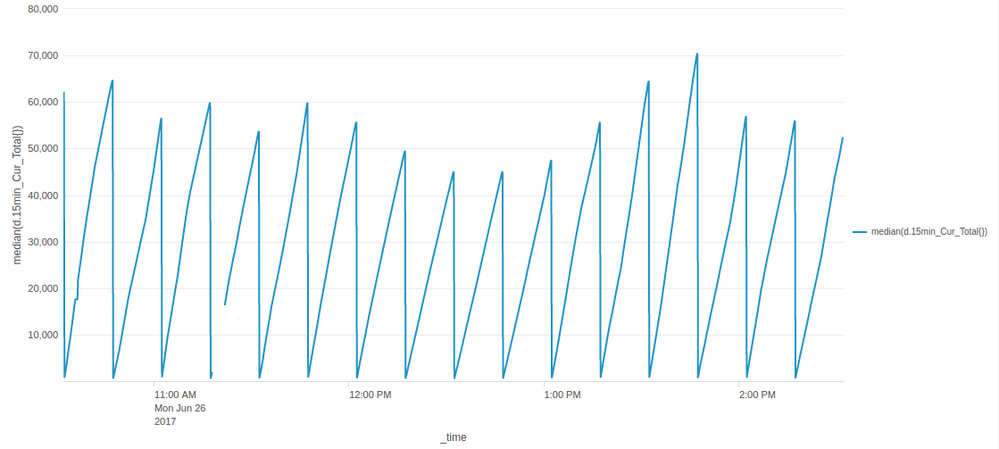
I would like to calculate the accumulated energy used over a period of 15 minutes. The sum has to start around min%15==0 (hh:00, hh:15, hh:30, hh:45). The plot should look similar to a sawtooth plot with accumulated power reset to 0 every 15 minutes.
Currently, I am able to create an accumulated plot for a specific window:
host=pm_energy | reverse | accum d.Act_power_realtime{} as tot_pow | timechart last(tot_pow) span=20s
But I couldn't get it to reset every 15 minutes. I want my graph to look like this:
Where the data used in the above graph is calculated in a separate program.
- Mark as New
- Bookmark Message
- Subscribe to Message
- Mute Message
- Subscribe to RSS Feed
- Permalink
- Report Inappropriate Content
Try this -
 host=pm_energy
| reverse
| rename COMMENT as "Above gets the records in time order"

| rename COMMENT as "Set each 15 minute time period as its own pulse of time"
| eval timepulse=floor(_time/900)

| rename COMMENT as "Accumulate power for each pulse"
| streamstats current=t sum(d.Act_power_realtime{}) as tot_pow by timepulse

| rename COMMENT as "Drop unneeded data and present results"
| table _time tot_pow
| timechart last(tot_pow) as tot_pow span=20s
Notes - You might want to consider whether you want 8:15 exactly to be the beginning of 8:15:00.000-8:29:59.999 or the end of 8:00:00.001-8:15:00.000
- Mark as New
- Bookmark Message
- Subscribe to Message
- Mute Message
- Subscribe to RSS Feed
- Permalink
- Report Inappropriate Content
Thank you! This works great!
- Mark as New
- Bookmark Message
- Subscribe to Message
- Mute Message
- Subscribe to RSS Feed
- Permalink
- Report Inappropriate Content
You can use streamtstats and the time_window option.
http://docs.splunk.com/Documentation/Splunk/latest/SearchReference/streamstats
host=pm_energy | streamstats time_window=15m sum(d.Act_power_realtime{}) as tot_pow | timechart last(tot_pow) span=20s
- Mark as New
- Bookmark Message
- Subscribe to Message
- Mute Message
- Subscribe to RSS Feed
- Permalink
- Report Inappropriate Content
I got an error saying by using the time_window the input has to be in sorted in time order. Any suggestion to fix this?
- Mark as New
- Bookmark Message
- Subscribe to Message
- Mute Message
- Subscribe to RSS Feed
- Permalink
- Report Inappropriate Content
Probably add |sort 0 +_time after the initial search filter.

