
Join the Conversation
- Find Answers
- :
- Using Splunk
- :
- Splunk Search
- :
- corresponding cell addition column wise for each r...
- Subscribe to RSS Feed
- Mark Topic as New
- Mark Topic as Read
- Float this Topic for Current User
- Bookmark Topic
- Subscribe to Topic
- Mute Topic
- Printer Friendly Page
- Mark as New
- Bookmark Message
- Subscribe to Message
- Mute Message
- Subscribe to RSS Feed
- Permalink
- Report Inappropriate Content

Hi,
Do we have a feature in splunk to add 1st row.field1 from 2 different panels and sum it in another panel.
i have in panel one or table 1 in dashboard which looks like below
col1 col2 col3 col4
A 1 1 1 1
B 2 2 2 2
I have 2nd table in the same dashboard which looks like below
col1 col2 col3 col4
A 3 3 3 3
B 4 4 4 4
I have one more tale which shoud look like below. Addition of col2 first row from both tables, addition of col3 of 1 row of both tables etc.
col1 col2 col3 col4
A 4 4 4 4
B 6 6 6 6
- Mark as New
- Bookmark Message
- Subscribe to Message
- Mute Message
- Subscribe to RSS Feed
- Permalink
- Report Inappropriate Content

Ok, let me give two options, hopefully one of them you can use. It uses run anywhere searches based on Splunk's _internal index. You can maybe correct/change them as per what you currently have but keep on using _internal index instead.
1) Option 1 : Using append with head 1. Here Post processing may be applicable provided all three panel searches can be derived out of same base search). Please confirm if this is so, otherwise it is better to use append (or appendcols).
2) Option 2: Use progress or done search event handler to get the default $result.<fieldName>$ token to fetch field values from first row of results and assign to tokens. This is what you require for your use case.
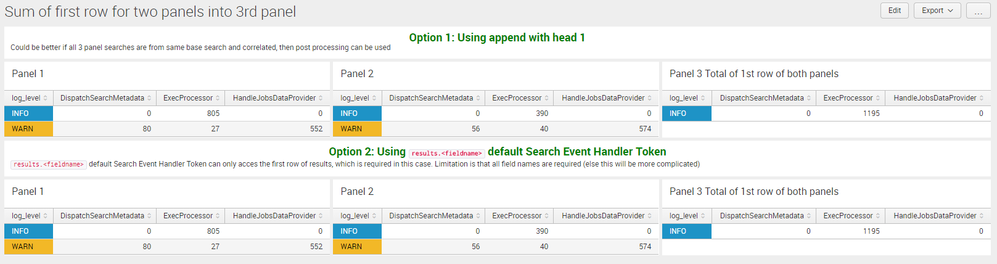
Following is the run anywhere dashboard for attached screenshot with both options in separate rows.
<dashboard>
  <label>Sum of first row for two panels into 3rd panel</label>
  <init>
    <set token="baseQuery">index=_internal sourcetype=splunkd log_level=INFO OR log_level="WARN" component IN ("DispatchSearchMetadata","ExecProcessor","HandleJobsDataProvider")</set>
  </init>
  <row>
    <panel>
      <html>
        <div style="color:green;font-weight:bold;font-size:150%;text-align:center">Option 1: Using append with head 1</div>
        <div>Could be better if all 3 panel searches are from same base search and correlated, then post processing can be used</div>
      </html>
    </panel>
  </row>
  <row>
    <panel>
      <title>Panel 1</title>
      <table>
        <search>
          <query>$baseQuery$ earliest=-7d@d latest=now
| chart count by log_level component</query>
        </search>
        <option name="drilldown">none</option>
        <format type="color" field="log_level">
          <colorPalette type="sharedList"></colorPalette>
          <scale type="sharedCategory"></scale>
        </format>
      </table>
    </panel>
    <panel>
      <title>Panel 2</title>
      <table>
        <search>
          <query>$baseQuery$ earliest=-14d@d latest=-7d@d
| chart count by log_level component</query>
        </search>
        <option name="drilldown">none</option>
        <format type="color" field="log_level">
          <colorPalette type="sharedList"></colorPalette>
          <scale type="sharedCategory"></scale>
        </format>
      </table>
    </panel>
    <panel>
      <title>Panel 3 Total of 1st row of both panels</title>
      <table>
        <search>
          <query>$baseQuery$ earliest=-7d@d latest=now
| chart count by log_level component
| head 1
| append [search $baseQuery$ earliest=-14d@d latest=-7d@d
| chart count by log_level component
| head 1]
| addcoltotals labelfield="log_level" label="INFO"
| tail 1</query>
        </search>
        <option name="drilldown">none</option>
        <format type="color" field="log_level">
          <colorPalette type="sharedList"></colorPalette>
          <scale type="sharedCategory"></scale>
        </format>
      </table>
    </panel>
  </row>
  <row>
    <panel>
      <html>
        <div style="color:green;font-weight:bold;font-size:150%;text-align:center">Option 2: Using <code>results.<fieldname></code> default Search Event Handler Token</div>
        <div><code>results.<fieldname></code> default Search Event Handler Token can only acces the first row of results, which is required in this case. Limitation is that all field names are required (else this will be more complicated)</div>
      </html>
    </panel>
  </row>
  <row>
    <panel>
      <title>Panel 1</title>
      <table>
        <search>
          <query>$baseQuery$ earliest=-7d@d latest=now
| chart count by log_level component</query>
          <done>
            <set token="log_level1">$result.log_level$</set>
            <set token="DispatchSearchMetadata1">$result.DispatchSearchMetadata$</set>
            <set token="ExecProcessor1">$result.ExecProcessor$</set>
            <set token="HandleJobsDataProvider1">$result.HandleJobsDataProvider$</set>
          </done>
        </search>
        <option name="drilldown">none</option>
        <format type="color" field="log_level">
          <colorPalette type="sharedList"></colorPalette>
          <scale type="sharedCategory"></scale>
        </format>
      </table>
    </panel>
    <panel>
      <title>Panel 2</title>
      <table>
        <search>
          <query>$baseQuery$ earliest=-14d@d latest=-7d@d
| chart count by log_level component</query>
          <done>
            <set token="log_level2">$result.log_level$</set>
            <set token="DispatchSearchMetadata2">$result.DispatchSearchMetadata$</set>
            <set token="ExecProcessor2">$result.ExecProcessor$</set>
            <set token="HandleJobsDataProvider2">$result.HandleJobsDataProvider$</set>
          </done>
        </search>
        <option name="drilldown">none</option>
        <format type="color" field="log_level">
          <colorPalette type="sharedList"></colorPalette>
          <scale type="sharedCategory"></scale>
        </format>
      </table>
    </panel>
    <panel>
      <title>Panel 3 Total of 1st row of both panels</title>
      <table>
        <search>
          <query>| makeresults
          | eval log_level="$log_level1$",DispatchSearchMetadata="$DispatchSearchMetadata1$",ExecProcessor="$ExecProcessor1$",HandleJobsDataProvider="$HandleJobsDataProvider1$"
          | append [| makeresults
          | eval log_level="$log_level2$",DispatchSearchMetadata="$DispatchSearchMetadata2$",ExecProcessor="$ExecProcessor2$",HandleJobsDataProvider="$HandleJobsDataProvider2$"]
          | fields - _time
          | addcoltotals labelfield="log_level" label="INFO"
          | tail 1
          | table log_level DispatchSearchMetadata ExecProcessor HandleJobsDataProvider</query>
        </search>
        <option name="drilldown">none</option>
        <format type="color" field="log_level">
          <colorPalette type="sharedList"></colorPalette>
          <scale type="sharedCategory"></scale>
        </format>
      </table>
    </panel>
  </row>
</dashboard>
PS: If this is not something you need please provide further details to assist.
| makeresults | eval message= "Happy Splunking!!!"

- Mark as New
- Bookmark Message
- Subscribe to Message
- Mute Message
- Subscribe to RSS Feed
- Permalink
- Report Inappropriate Content
Ok, let me give two options, hopefully one of them you can use. It uses run anywhere searches based on Splunk's _internal index. You can maybe correct/change them as per what you currently have but keep on using _internal index instead.
1) Option 1 : Using append with head 1. Here Post processing may be applicable provided all three panel searches can be derived out of same base search). Please confirm if this is so, otherwise it is better to use append (or appendcols).
2) Option 2: Use progress or done search event handler to get the default $result.<fieldName>$ token to fetch field values from first row of results and assign to tokens. This is what you require for your use case.
Following is the run anywhere dashboard for attached screenshot with both options in separate rows.
<dashboard>
  <label>Sum of first row for two panels into 3rd panel</label>
  <init>
    <set token="baseQuery">index=_internal sourcetype=splunkd log_level=INFO OR log_level="WARN" component IN ("DispatchSearchMetadata","ExecProcessor","HandleJobsDataProvider")</set>
  </init>
  <row>
    <panel>
      <html>
        <div style="color:green;font-weight:bold;font-size:150%;text-align:center">Option 1: Using append with head 1</div>
        <div>Could be better if all 3 panel searches are from same base search and correlated, then post processing can be used</div>
      </html>
    </panel>
  </row>
  <row>
    <panel>
      <title>Panel 1</title>
      <table>
        <search>
          <query>$baseQuery$ earliest=-7d@d latest=now
| chart count by log_level component</query>
        </search>
        <option name="drilldown">none</option>
        <format type="color" field="log_level">
          <colorPalette type="sharedList"></colorPalette>
          <scale type="sharedCategory"></scale>
        </format>
      </table>
    </panel>
    <panel>
      <title>Panel 2</title>
      <table>
        <search>
          <query>$baseQuery$ earliest=-14d@d latest=-7d@d
| chart count by log_level component</query>
        </search>
        <option name="drilldown">none</option>
        <format type="color" field="log_level">
          <colorPalette type="sharedList"></colorPalette>
          <scale type="sharedCategory"></scale>
        </format>
      </table>
    </panel>
    <panel>
      <title>Panel 3 Total of 1st row of both panels</title>
      <table>
        <search>
          <query>$baseQuery$ earliest=-7d@d latest=now
| chart count by log_level component
| head 1
| append [search $baseQuery$ earliest=-14d@d latest=-7d@d
| chart count by log_level component
| head 1]
| addcoltotals labelfield="log_level" label="INFO"
| tail 1</query>
        </search>
        <option name="drilldown">none</option>
        <format type="color" field="log_level">
          <colorPalette type="sharedList"></colorPalette>
          <scale type="sharedCategory"></scale>
        </format>
      </table>
    </panel>
  </row>
  <row>
    <panel>
      <html>
        <div style="color:green;font-weight:bold;font-size:150%;text-align:center">Option 2: Using <code>results.<fieldname></code> default Search Event Handler Token</div>
        <div><code>results.<fieldname></code> default Search Event Handler Token can only acces the first row of results, which is required in this case. Limitation is that all field names are required (else this will be more complicated)</div>
      </html>
    </panel>
  </row>
  <row>
    <panel>
      <title>Panel 1</title>
      <table>
        <search>
          <query>$baseQuery$ earliest=-7d@d latest=now
| chart count by log_level component</query>
          <done>
            <set token="log_level1">$result.log_level$</set>
            <set token="DispatchSearchMetadata1">$result.DispatchSearchMetadata$</set>
            <set token="ExecProcessor1">$result.ExecProcessor$</set>
            <set token="HandleJobsDataProvider1">$result.HandleJobsDataProvider$</set>
          </done>
        </search>
        <option name="drilldown">none</option>
        <format type="color" field="log_level">
          <colorPalette type="sharedList"></colorPalette>
          <scale type="sharedCategory"></scale>
        </format>
      </table>
    </panel>
    <panel>
      <title>Panel 2</title>
      <table>
        <search>
          <query>$baseQuery$ earliest=-14d@d latest=-7d@d
| chart count by log_level component</query>
          <done>
            <set token="log_level2">$result.log_level$</set>
            <set token="DispatchSearchMetadata2">$result.DispatchSearchMetadata$</set>
            <set token="ExecProcessor2">$result.ExecProcessor$</set>
            <set token="HandleJobsDataProvider2">$result.HandleJobsDataProvider$</set>
          </done>
        </search>
        <option name="drilldown">none</option>
        <format type="color" field="log_level">
          <colorPalette type="sharedList"></colorPalette>
          <scale type="sharedCategory"></scale>
        </format>
      </table>
    </panel>
    <panel>
      <title>Panel 3 Total of 1st row of both panels</title>
      <table>
        <search>
          <query>| makeresults
          | eval log_level="$log_level1$",DispatchSearchMetadata="$DispatchSearchMetadata1$",ExecProcessor="$ExecProcessor1$",HandleJobsDataProvider="$HandleJobsDataProvider1$"
          | append [| makeresults
          | eval log_level="$log_level2$",DispatchSearchMetadata="$DispatchSearchMetadata2$",ExecProcessor="$ExecProcessor2$",HandleJobsDataProvider="$HandleJobsDataProvider2$"]
          | fields - _time
          | addcoltotals labelfield="log_level" label="INFO"
          | tail 1
          | table log_level DispatchSearchMetadata ExecProcessor HandleJobsDataProvider</query>
        </search>
        <option name="drilldown">none</option>
        <format type="color" field="log_level">
          <colorPalette type="sharedList"></colorPalette>
          <scale type="sharedCategory"></scale>
        </format>
      </table>
    </panel>
  </row>
</dashboard>
PS: If this is not something you need please provide further details to assist.
| makeresults | eval message= "Happy Splunking!!!"
- Mark as New
- Bookmark Message
- Subscribe to Message
- Mute Message
- Subscribe to RSS Feed
- Permalink
- Report Inappropriate Content
@surekhasplunk, definitely possible through couple of options. However, which one is the best depends on what search queries you are running for table 1 and table 2. Would it be possible for you to share? Maybe call your fields in query as col1 col2 col3 and col4 as per sample data (if required). Or else give the output again with correct field names.
| makeresults | eval message= "Happy Splunking!!!"
- Mark as New
- Bookmark Message
- Subscribe to Message
- Mute Message
- Subscribe to RSS Feed
- Permalink
- Report Inappropriate Content
Its not possible for me to share the queries is it possible for you to just share a sample query with above data and fields.

Join the Splunk Community Slack to learn, troubleshoot, and make connections with fellow Splunk practitioners in real time!
Join Splunk User Groups to connect and learn in-person by region or remotely by topic or industry.
Announcing Modern Navigation: A New Era of Splunk User Experience
Modernize your Splunk Apps – Introducing Python 3.13 in Splunk
Step into “Hunt the Insider: An Splunk ES Premier Mystery” to catch a cybercriminal ...
