
Join the Conversation
- Find Answers
- :
- Using Splunk
- :
- Splunk Search
- :
- chart time based
- Subscribe to RSS Feed
- Mark Topic as New
- Mark Topic as Read
- Float this Topic for Current User
- Bookmark Topic
- Subscribe to Topic
- Mute Topic
- Printer Friendly Page
- Mark as New
- Bookmark Message
- Subscribe to Message
- Mute Message
- Subscribe to RSS Feed
- Permalink
- Report Inappropriate Content

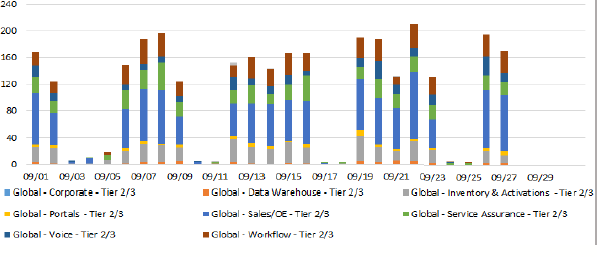
Hi ,
I want a chart exactly like the image attached.
My data is input lookup csv file .
My time filed name is "Opened"
Data Global * field name is "Assignment group"
Please help me with the query.
I tried something like this but this is not what i want.
index=level3 host=Test | chart count over Opened by "Assignment group"
Thanks
- Mark as New
- Bookmark Message
- Subscribe to Message
- Mute Message
- Subscribe to RSS Feed
- Permalink
- Report Inappropriate Content
My first stab at it would be something like this. This will give you 14 days, including yesterday, but not today.
index=level3 host=Test earliest="-14d@d" latest="-0d@d" | timechart span=1d limit=20 count Opened by "Assignment group"
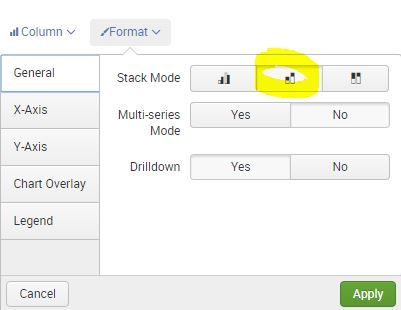
Then in the visualations tab change the format to Column, and Format, stacked.
- Mark as New
- Bookmark Message
- Subscribe to Message
- Mute Message
- Subscribe to RSS Feed
- Permalink
- Report Inappropriate Content


Are the values in the "Opened" field epochtime values? ie integer numbers of seconds since 1/1/1970, or are they string formatted times. If the latter can you give an example value? Long story short you need to rename the time field to be "_time" and then convert it to epochtime format if it's not already. Then timechart will happily work with it just as though the rows were coming from regular indexed events.
- Mark as New
- Bookmark Message
- Subscribe to Message
- Mute Message
- Subscribe to RSS Feed
- Permalink
- Report Inappropriate Content
My first stab at it would be something like this. This will give you 14 days, including yesterday, but not today.
index=level3 host=Test earliest="-14d@d" latest="-0d@d" | timechart span=1d limit=20 count Opened by "Assignment group"
Then in the visualations tab change the format to Column, and Format, stacked.
- Mark as New
- Bookmark Message
- Subscribe to Message
- Mute Message
- Subscribe to RSS Feed
- Permalink
- Report Inappropriate Content
Now am getting results with the below query but am unable to sort it date wise rather it sorts numerically.
I have two date fields with values like this:
Opened = 09/27
Opened D = 09/29/16
Figure1
index=level3 host=Test | eval _time=strptime("Opened D","%Y-%m-%d %H:%M:%S.%N")|chart count OVER "Opened D" BY "Assignment group" | sort -"Opened D"
Figure2
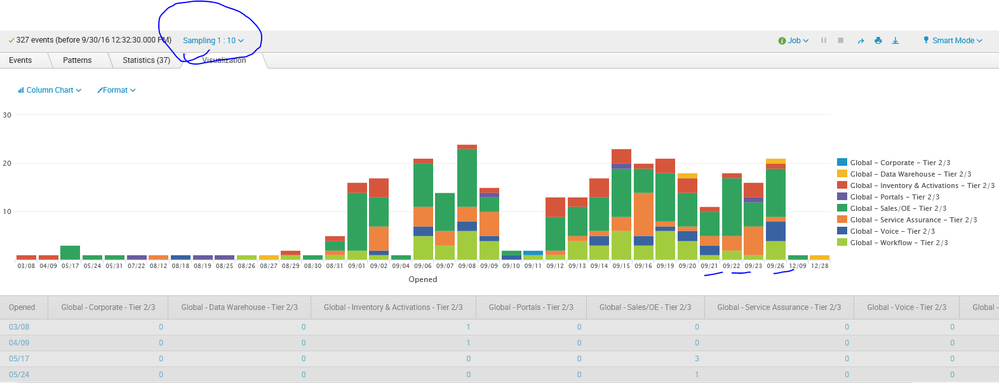
One more thing in the x-axis instead of “Opened D” how can I get the actual dates ?
If I enable event sampling only then am getting the dates if I slect “No event sampling” then the dates aren’t reflecting. How to solve this ?
And if I am enabling event sampling am missing some dates data also.
- Mark as New
- Bookmark Message
- Subscribe to Message
- Mute Message
- Subscribe to RSS Feed
- Permalink
- Report Inappropriate Content
I think you're going to have to use timechart instead of chart.
http://docs.splunk.com/Documentation/Splunk/6.4.3/SearchReference/Timechart
Maybe..
...|timechart span=1d count(Opened) by "Assignment group"




Join the Splunk Community Slack to learn, troubleshoot, and make connections with fellow Splunk practitioners in real time!
Join Splunk User Groups to connect and learn in-person by region or remotely by topic or industry.
Painting a Clearer Picture: Unifying Your Investigations with Cisco AI Canvas
Hello POJO, meet nocode
Announcing Modern Navigation: A New Era of Splunk User Experience
