
Join the Conversation
- Find Answers
- :
- Using Splunk
- :
- Splunk Search
- :
- Re: Why does placing "table _time" after timechart...
- Subscribe to RSS Feed
- Mark Topic as New
- Mark Topic as Read
- Float this Topic for Current User
- Bookmark Topic
- Subscribe to Topic
- Mute Topic
- Printer Friendly Page
- Mark as New
- Bookmark Message
- Subscribe to Message
- Mute Message
- Subscribe to RSS Feed
- Permalink
- Report Inappropriate Content

I have a simple search like:
sourcetype="A" | timechart span="1h" avg(x) as AvgCode
and the resulting visualization is:
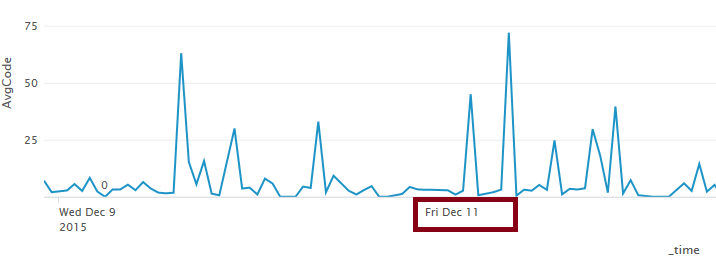
But if insert a table command after `timechart' (which shouldn't change anything),
sourcetype="A" | timechart span="1h" avg(x) as AvgCode | table _time, AvgCode
labels on the x-axis disappear:
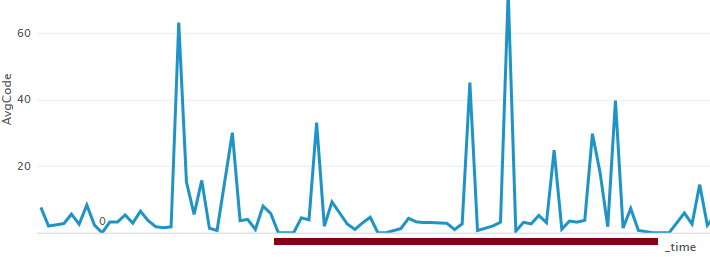
Why does it happen?
The results are absolutely the same and I'm keeping the _time field in the resulting data.


- Mark as New
- Bookmark Message
- Subscribe to Message
- Mute Message
- Subscribe to RSS Feed
- Permalink
- Report Inappropriate Content


Hi @greg,
I think the problem might be using "timechart" with "table". The "table" command documentation includes this note:
"The table command can be used to build a scatter plot to show trends in the relationships between discrete values of your data. Otherwise, you should not use it for charts (such as chart or timechart) because the UI requires the internal fields (which are the fields beginning with an underscore, _*) to render the charts, and the table command strips these fields out of the results by default. Instead, you should use the fields command because it always retains all the internal fields."
http://docs.splunk.com/Documentation/Splunk/6.3.1/SearchReference/Table
Here is documentation for the "fields" command:
http://docs.splunk.com/Documentation/Splunk/6.3.1/SearchReference/Fields
Can you try using "fields" instead? Let me know if this does not help.
Best,
@frobinson_splunk
- Mark as New
- Bookmark Message
- Subscribe to Message
- Mute Message
- Subscribe to RSS Feed
- Permalink
- Report Inappropriate Content
Hi @greg,
I think the problem might be using "timechart" with "table". The "table" command documentation includes this note:
"The table command can be used to build a scatter plot to show trends in the relationships between discrete values of your data. Otherwise, you should not use it for charts (such as chart or timechart) because the UI requires the internal fields (which are the fields beginning with an underscore, _*) to render the charts, and the table command strips these fields out of the results by default. Instead, you should use the fields command because it always retains all the internal fields."
http://docs.splunk.com/Documentation/Splunk/6.3.1/SearchReference/Table
Here is documentation for the "fields" command:
http://docs.splunk.com/Documentation/Splunk/6.3.1/SearchReference/Fields
Can you try using "fields" instead? Let me know if this does not help.
Best,
@frobinson_splunk
- Mark as New
- Bookmark Message
- Subscribe to Message
- Mute Message
- Subscribe to RSS Feed
- Permalink
- Report Inappropriate Content
Yes, specifying 'fields _time, AvgCode' or 'table _*, AvgCode' returned x-axis labels back.
Thank you for pointing this out!
- Mark as New
- Bookmark Message
- Subscribe to Message
- Mute Message
- Subscribe to RSS Feed
- Permalink
- Report Inappropriate Content
Ah, great. Glad that this worked!
@frobinson_splunk

Join the Splunk Community Slack to learn, troubleshoot, and make connections with fellow Splunk practitioners in real time!
Join Splunk User Groups to connect and learn in-person by region or remotely by topic or industry.
Announcing Modern Navigation: A New Era of Splunk User Experience
Modernize your Splunk Apps – Introducing Python 3.13 in Splunk
Step into “Hunt the Insider: An Splunk ES Premier Mystery” to catch a cybercriminal ...
