
Join the Conversation
- Find Answers
- :
- Using Splunk
- :
- Splunk Search
- :
- Re: Using timechat with 2 fields without any field...
- Subscribe to RSS Feed
- Mark Topic as New
- Mark Topic as Read
- Float this Topic for Current User
- Bookmark Topic
- Subscribe to Topic
- Mute Topic
- Printer Friendly Page
- Mark as New
- Bookmark Message
- Subscribe to Message
- Mute Message
- Subscribe to RSS Feed
- Permalink
- Report Inappropriate Content
Using timechat with 2 fields without any field calculation

Hi,
I'm new in Splunk (and my knowledge is very very basic) and I have to build a complex dashboard with multiple indexes. I've tried googling it and I did not find anything related to my needs.
So, I have my index with a log file from a group of servers (farm) and that log is imported every hour. This log has 2 sourcetypes (users and computers).
My logfile has this name: ControlUp_Sessions_01_24_2017_12_00.csv and "12_00" represents the hour that is imported to splunk.
I need to build a line chart by hour for a specific user (variable from an input field) with his "session Latency" and "CPU Usage"
With this query I have my results:
index=controlup sourcetype="csv-sessions" User="XPTO"
| table "Protocol Latency _ Session Avg", CPU
But using a "Timechart" with "span=1h" all examples have an "eval" or an "avg" and I don't need that.
I've tried and I have the results but only with AVG:
index=controlup sourcetype="csv-sessions" User="XPTO"
| timechart span=60m avg("Protocol Latency _ Session Avg")
| appendcols [search index=controlup sourcetype="csv-sessions" User="XPTO" | timechart span=60m avg(CPU)]
Basiclly I need a timeline with CPU usage and latency during the day for a selected user without any calculated value/field.
Can someone point me to the rigth direction, please?
- Mark as New
- Bookmark Message
- Subscribe to Message
- Mute Message
- Subscribe to RSS Feed
- Permalink
- Report Inappropriate Content

Give this a try
index=pt_app_it_citrix_controlup sourcetype="csv-sessions" User="$username_field1$"
| rex field=source ".*_(?<![CDATA[<timestamp>]]>\d{2}_\d{2}_\d{4}_\d{2}_\d{2}.csv"
| eval _time = strptime(timestamp,"%m-%d-%Y %H:%M")
| table _time 'Protocol Latency _ Session Avg' CPU
| sort _time
- Mark as New
- Bookmark Message
- Subscribe to Message
- Mute Message
- Subscribe to RSS Feed
- Permalink
- Report Inappropriate Content

Have you tried just this:
index=controlup sourcetype="csv-sessions" User="XPTO"
| timechart span=60m avg("Protocol Latency _ Session Avg")  avg(CPU)
You can specify multiple stats in a timechart
- Mark as New
- Bookmark Message
- Subscribe to Message
- Mute Message
- Subscribe to RSS Feed
- Permalink
- Report Inappropriate Content
After several attemps I have my timeline like this:
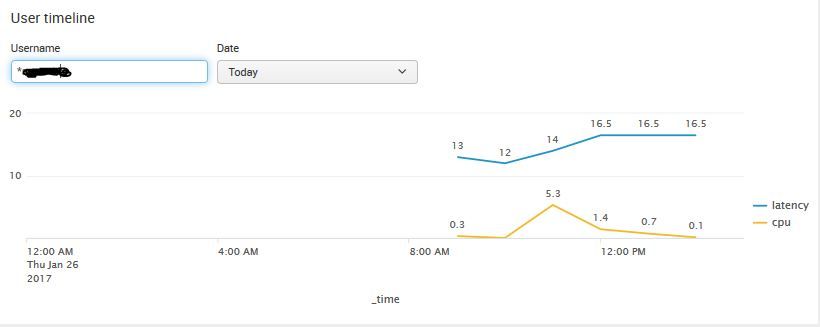
<panel>
  <title>User timeline</title>
  <input type="text" token="username_field1" searchWhenChanged="true">
    <label>Username</label>
    <initialValue>*</initialValue>
    <default>*</default>
  </input>
  <input type="time" token="dash_date1" searchWhenChanged="true">
    <label>Date</label>
    <default>
      <earliest>@d</earliest>
      <latest>now</latest>
    </default>
  </input>
  <chart>
    <search>
      <query>
        index=pt_app_it_citrix_controlup sourcetype="csv-sessions" User="$username_field1$"
        | rex field=source ".*_(?<![CDATA[<date>]]>[0-9]+_[0-9]+_[0-9]+)_[0-9]+_[0-9]+_[0-9]+.csv"
        | rex field=source ".*_(?<![CDATA[<hour>]]>[0-9]+_[0-9]+)_[0-9]+.csv"
        | eval _time = strptime(replace(date,"_","-") + " " + replace(hour,"_",":")+":00", "%m-%d-%Y %H:%M:%S")
        | timechart span=60m eval(round(avg('Protocol Latency _ Session Avg'),1)) as latency, eval(round(avg(CPU)/100,1)) as cpu
        | sort _time
    </query>
      <earliest>$dash_date1.earliest$</earliest>
      <latest>$dash_date1.latest$</latest>
    </search>
    <option name="charting.chart">line</option>
    <option name="charting.chart.showDataLabels">all</option>
  </chart>
</panel>
But I still have to apply the AVG:
| timechart span=60m eval(round(avg('Protocol Latency _ Session Avg'),1)) as latency, eval(round(avg(CPU)/100,1)) as cpu
Is there anyway to put these values As Is on a Timechart without the AVG ?
Thanks !!!



Join the Splunk Community Slack to learn, troubleshoot, and make connections with fellow Splunk practitioners in real time!
Join Splunk User Groups to connect and learn in-person by region or remotely by topic or industry.
Splunk Auto Ingestion Parallel Pipeline Scaling
Best Practices: Splunk auto adjust pipeline queue
Announcing Modern Navigation: A New Era of Splunk User Experience
