Join the Conversation
- Find Answers
- :
- Using Splunk
- :
- Splunk Search
- :
- Re: Using span option with timechart causes incorr...
- Subscribe to RSS Feed
- Mark Topic as New
- Mark Topic as Read
- Float this Topic for Current User
- Bookmark Topic
- Subscribe to Topic
- Mute Topic
- Printer Friendly Page
- Mark as New
- Bookmark Message
- Subscribe to Message
- Mute Message
- Subscribe to RSS Feed
- Permalink
- Report Inappropriate Content
Splunk Ver : I tested in 7.3.0 and 6.6.12.
Timezone : I don't know if it’s relevant to this problem, but it is JST
If I run following search, column name will be "99".
| makeresults count=10
| eval field=99
| timechart count by field
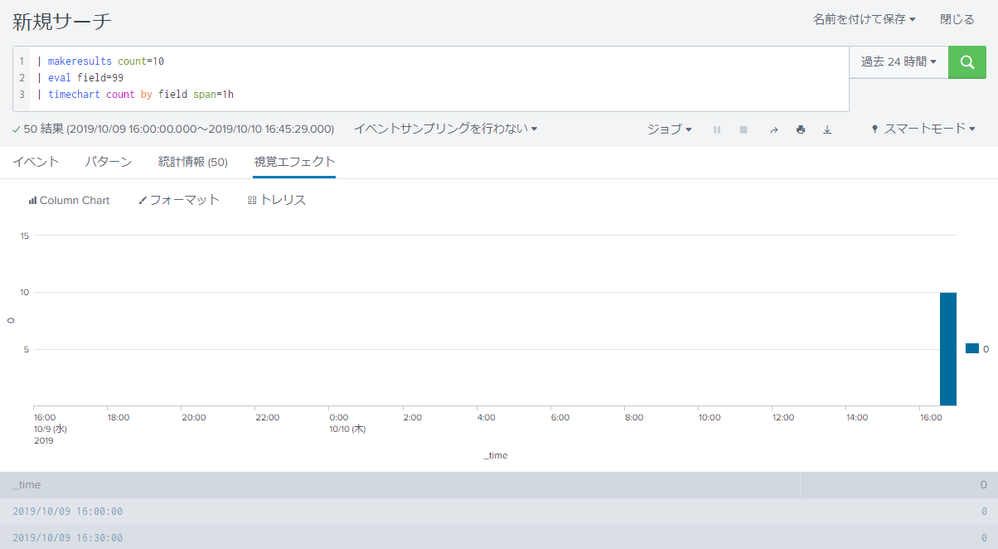
But If I using span option like below, column name changes.
Pattern 1)
    | makeresults count=10
    | eval field=99
    | timechart count by field span=1h
Result 1)
    column name changes to "0".

Pattern 2)
    | makeresults count=10
    | eval field=99
    | timechart count by field span=1m
Result 2)
    column name changes to "60".

Pattern 3)
    | makeresults count=10
    | eval field=99
    | timechart count by field span=1d
Result 3)
    column name changes to "-32400"!
This time, I used makeresults as a sample.
But, if I want to use timechart by some number field like destination port or ID_number in actual operation, it would be a problem if the displayed column names are different.
Is this issue?
Or specification? If so, is there a way to avoid?
- Mark as New
- Bookmark Message
- Subscribe to Message
- Mute Message
- Subscribe to RSS Feed
- Permalink
- Report Inappropriate Content
Sorry... moving span option to after timechart command like below, it worked correctly...
Before)
timechart count by field span=1h
After)
timechart span=1h count by field
I was thinking that I can put span option anywhere.
- Mark as New
- Bookmark Message
- Subscribe to Message
- Mute Message
- Subscribe to RSS Feed
- Permalink
- Report Inappropriate Content
Hi yutaka1005,
span hasn't any impact on column names, can you share your search, probably the cause of this behaviour is in the search.
Bye.
Giuseppe
- Mark as New
- Bookmark Message
- Subscribe to Message
- Mute Message
- Subscribe to RSS Feed
- Permalink
- Report Inappropriate Content
Sorry, it was solved by myself.
Thank you for comment!

