
Join the Conversation
- Find Answers
- :
- Using Splunk
- :
- Splunk Search
- :
- Re: To extract a string which has numeric value an...
- Subscribe to RSS Feed
- Mark Topic as New
- Mark Topic as Read
- Float this Topic for Current User
- Bookmark Topic
- Subscribe to Topic
- Mute Topic
- Printer Friendly Page
- Mark as New
- Bookmark Message
- Subscribe to Message
- Mute Message
- Subscribe to RSS Feed
- Permalink
- Report Inappropriate Content
To extract a string which has numeric value and get the count

I have logs in splunk as mentioned below
3/22/19
2:05:44.000 PM
Date = 2019-03-22 13:58:19,827 | Level = INFO | RequestID = 5131ffcba936427599a228951e21 | ErrorCode = (null) | ErrorMessage = Records details | Alert = false | Message = Manufacture:Actia;Total Records:1;Processed Records:1;Failed Records:0
In the above log there is a field called Message which has string with the information of the Manufacture and number of records.
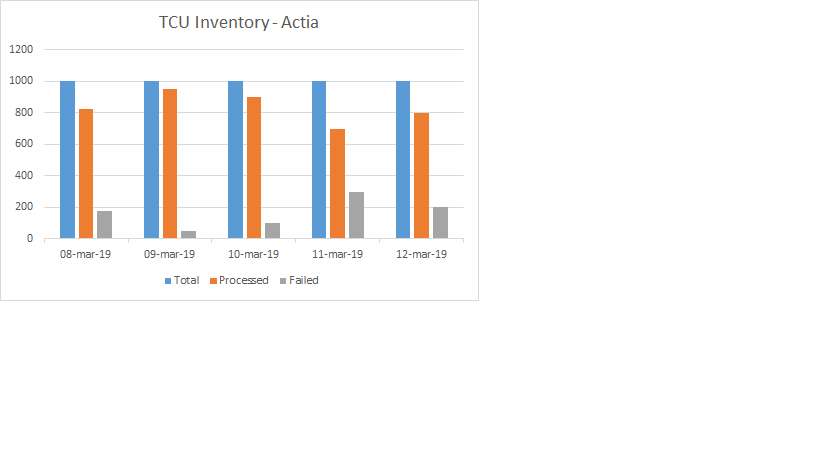
I need to write a query which extracts Total number of records , processed records and failed records value and get the count and show it in a bar chart.
Below is the query which i have written which is not giving the expected result
index =".." "Failed Records" "Manufacture:Actia" |rex field=_raw "Total Records:(?\d+);Processed Records:(?\d+);Failed Records:(?\d+)" |timechart count(total) as Total, count(processed) as processed,count(failed) as Failed
i need the bar chart as attached below.
Please suggest
- Mark as New
- Bookmark Message
- Subscribe to Message
- Mute Message
- Subscribe to RSS Feed
- Permalink
- Report Inappropriate Content

Hi
To extract try this
..|rex field=Message "Manufacture\:(?P<Manufacture>\w+);Total Records\:(?P<Total_Records>\d+)\;Processed Records:(?P<Processed_Records>\d+)\;Failed Records\:(?P<Failed_Records>\d+)"



Join the Splunk Community Slack to learn, troubleshoot, and make connections with fellow Splunk practitioners in real time!
Join Splunk User Groups to connect and learn in-person by region or remotely by topic or industry.
At .conf26, Don’t Just See What’s Next. Help Shape It at Innovation Labs.
Forwarder Topology Guidance: Intermediate HF vs Intermediate UF
Data Management Digest – August 2026
