Join the Conversation
- Find Answers
- :
- Using Splunk
- :
- Splunk Search
- :
- Timechart on field other than _time
- Subscribe to RSS Feed
- Mark Topic as New
- Mark Topic as Read
- Float this Topic for Current User
- Bookmark Topic
- Subscribe to Topic
- Mute Topic
- Printer Friendly Page
- Mark as New
- Bookmark Message
- Subscribe to Message
- Mute Message
- Subscribe to RSS Feed
- Permalink
- Report Inappropriate Content
Hello,
I'm working on a time chart that needs to chart based on the time retrieved from the database. So far, the chart is only working with _time. Here is my query so far:
| dbxquery SQL query | dedup id_number| eval _time=strptime("date time","%Y-%m-%d %H:%M:%S.%N") | eval _time="date time" | timechart span=1d sum("Projected_Cost") as Potential_Cost by Incedent
So far, though, all I've gotten is a blank chart. Here is an example time stamp:
2017-03-14 17:19:25.0
If anyone can give me any help whatsoever, that would be great. I've been hitting a wall with this for several hours.
Thanks.
- Mark as New
- Bookmark Message
- Subscribe to Message
- Mute Message
- Subscribe to RSS Feed
- Permalink
- Report Inappropriate Content
@DalJeanis, thank you for your comment
placing in an answer so i can show screenshot
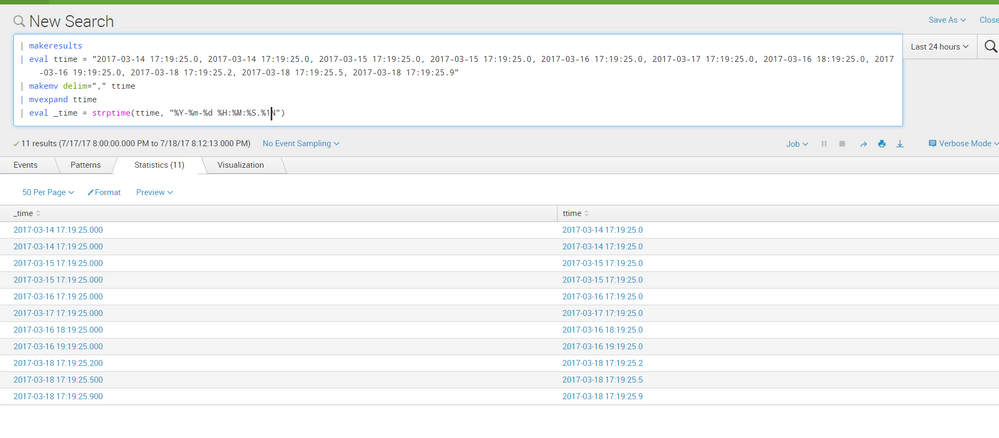
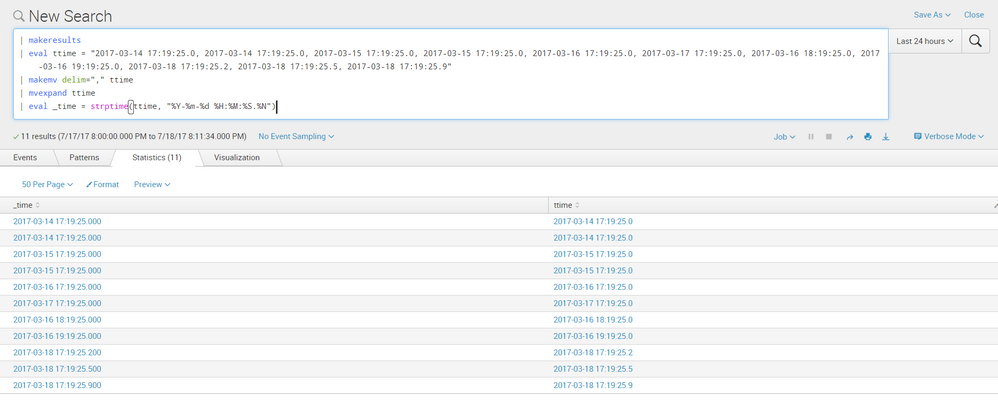
tried with .%1N and .%N and added some miliseconds 2, 5, and 9 to verify.
the results are the same and looks like the default is %3N regardless:
as for the question,
i hope it answers it already. if not, please let us know how we can further assist
- Mark as New
- Bookmark Message
- Subscribe to Message
- Mute Message
- Subscribe to RSS Feed
- Permalink
- Report Inappropriate Content
Every time I try to test, it returns the error:
Error in 'eval' command: The expression is malformed. Expected ).
Which doesn't make any sense, since the last character is the closing parenthesis.
| dbxquery query="SQL query here"| dedup id_number | rename "SQL Submit Date" as SubmitDate| eval ttime=SubmitDate | makemv delim="," ttime | mvexpand ttime | eval _time=(ttime, "%Y-%m-%d %H:%M:%S.%N")
Before that, it seems to work fine, so my best guess is that its an issue with the time format.
- Mark as New
- Bookmark Message
- Subscribe to Message
- Mute Message
- Subscribe to RSS Feed
- Permalink
- Report Inappropriate Content
Nevermind, I got it to work. I must have forgotten strptime:
| dbxquery query="SQL query here" | dedup id_number |rename "SQL Submit Date" as SubmitDate| eval ttime=SubmitDate | makemv delim="," ttime | mvexpand ttime | eval _time=strptime(ttime, "%Y-%m-%d %H:%M:%S.%N") | timechart span=1d sum("Projected_Cost") as Potential_Cost by Incident
THANK YOU!!!
- Mark as New
- Bookmark Message
- Subscribe to Message
- Mute Message
- Subscribe to RSS Feed
- Permalink
- Report Inappropriate Content
why do you have the ... | eval _time="data time" ?
try and remove it and run:
| dbxquery SQL query
| dedup id_number
| eval _time=strptime("date time","%Y-%m-%d %H:%M:%S.%N")
| timechart span=1d sum("Projected_Cost") as Potential_Cost by Incedent
- Mark as New
- Bookmark Message
- Subscribe to Message
- Mute Message
- Subscribe to RSS Feed
- Permalink
- Report Inappropriate Content
I'm basing that part off of this answer here:
https://answers.splunk.com/answers/145562/how-to-use-a-field-as-timestamp-for-a-timechart.html
Removing it causes the search to fail.
- Mark as New
- Bookmark Message
- Subscribe to Message
- Mute Message
- Subscribe to RSS Feed
- Permalink
- Report Inappropriate Content
tried it again and it works nicely
try this search:
| makeresults
| eval ttime = "2017-03-14 17:19:25.0, 2017-03-14 17:19:25.0, 2017-03-15 17:19:25.0, 2017-03-15 17:19:25.0, 2017-03-16 17:19:25.0, 2017-03-17 17:19:25.0"
| makemv delim="," ttime
| mvexpand ttime
| eval _time = strptime(ttime, "%Y-%m-%d %H:%M:%S.%N")
| timechart count
- Mark as New
- Bookmark Message
- Subscribe to Message
- Mute Message
- Subscribe to RSS Feed
- Permalink
- Report Inappropriate Content
@adonio - It shouldn't work. I've forgotten which of N or Q defaults to 3 vs 6 digits, but you should need to tell %N that there's only 1 digit. try %1N
https://docs.splunk.com/Documentation/SplunkCloud/6.6.0/SearchReference/Commontimeformatvariables


