
Join the Conversation
- Find Answers
- :
- Using Splunk
- :
- Splunk Search
- :
- Re: Timechart Span problem
- Subscribe to RSS Feed
- Mark Topic as New
- Mark Topic as Read
- Float this Topic for Current User
- Bookmark Topic
- Subscribe to Topic
- Mute Topic
- Printer Friendly Page
- Mark as New
- Bookmark Message
- Subscribe to Message
- Mute Message
- Subscribe to RSS Feed
- Permalink
- Report Inappropriate Content
Timechart Span problem

Hi ,
Question regarding splunk timechart
if i ran the command :
index=_internal earliest=-1@d latest=now()
| timechart span=1h count by host
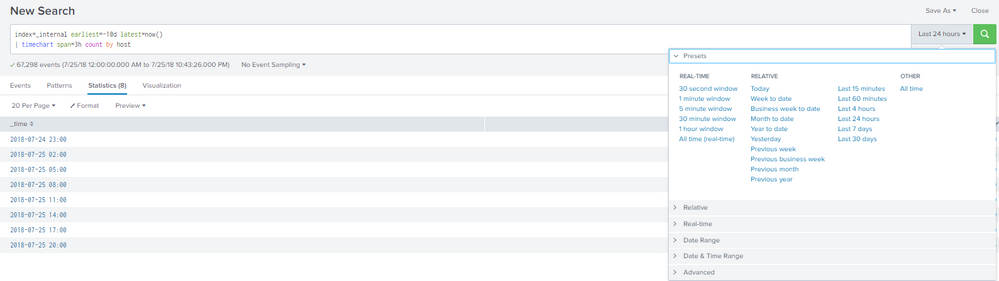
it returns data from "2018-07-24 23:00"
but when i set timechart span=1h , it starts "2018-07-25 00:00"
I am expecting Format to be :
_time
"2018-07-25 00:00"
"2018-07-25 03:00"
"2018-07-25 06:00"
Can somebody tell me why does the span command override the time configured?
Also, how can I resolve this problem?
Thanks in advance.
- Mark as New
- Bookmark Message
- Subscribe to Message
- Mute Message
- Subscribe to RSS Feed
- Permalink
- Report Inappropriate Content

You're right !
It shows you a time that is not in your time range but you will only have the result from your time range.
I'm sure if you run this query :
index=_internal earliest=-2d@d latest=-1d@d
 | timechart span=2h count by host
And this one
index=_internal earliest=-2d@d latest=-1d@d
 | timechart span=3h count by host
You will have the same result in the first row.
it just because Splunk has to find a way to display the data with the span you gave.
But I don't know how it works and how to display it the way you want it...
KailA
- Mark as New
- Bookmark Message
- Subscribe to Message
- Mute Message
- Subscribe to RSS Feed
- Permalink
- Report Inappropriate Content

@jadengoho
can you please give a try with below query
index=_internal  earliest=@d latest=now()
| timechart span=2h count,values(_time) as time  by host
- Mark as New
- Bookmark Message
- Subscribe to Message
- Mute Message
- Subscribe to RSS Feed
- Permalink
- Report Inappropriate Content
Yes that would work on span=(1 AND 2)h
but when you set to 3h above , it will show time that is not included in the time range i set.



Join the Splunk Community Slack to learn, troubleshoot, and make connections with fellow Splunk practitioners in real time!
Join Splunk User Groups to connect and learn in-person by region or remotely by topic or industry.
Mastering Threat Intelligence in ES 8.5, Splunk AI Assistant v2, and More from Splunk ...
Break the Build: Inside the KubeDoom Lounge at .conf26
Splunk Auto Ingestion Parallel Pipeline Scaling
